What is the Diagnostic Panel?#
The Diagnostic Panel is an advanced administrative tool built into Higson Studio, designed for monitoring, profiling, and diagnostics of the Higson decision engine instances. It enables administrators and developers to gain insight into the internal system state, operation performance, and licence management.
Who is it intended for?#
- System administrators — server health monitoring, licence management, resource control
- Developers — cache debugging, business rule performance analysis, SQL query optimization
- DevOps teams — CPU, RAM, JVM thread monitoring
- Support teams — real-time production issue diagnostics
Key Capabilities#
| Feature | Description |
|---|---|
| Cache profiling | Viewing the contents of the engine’s cache. |
| Execution statistics | Metrics for function, flows, domain, and decision table call times. |
| Resource monitoring | Real-time CPU, RAM, thread, GC charts. |
| Performance analysis | Rule execution history with duration times. |
| Licence management | View limits, core usage, and compliance metrics. |
| JDBC monitoring | View SQL queries generated by the engine. |
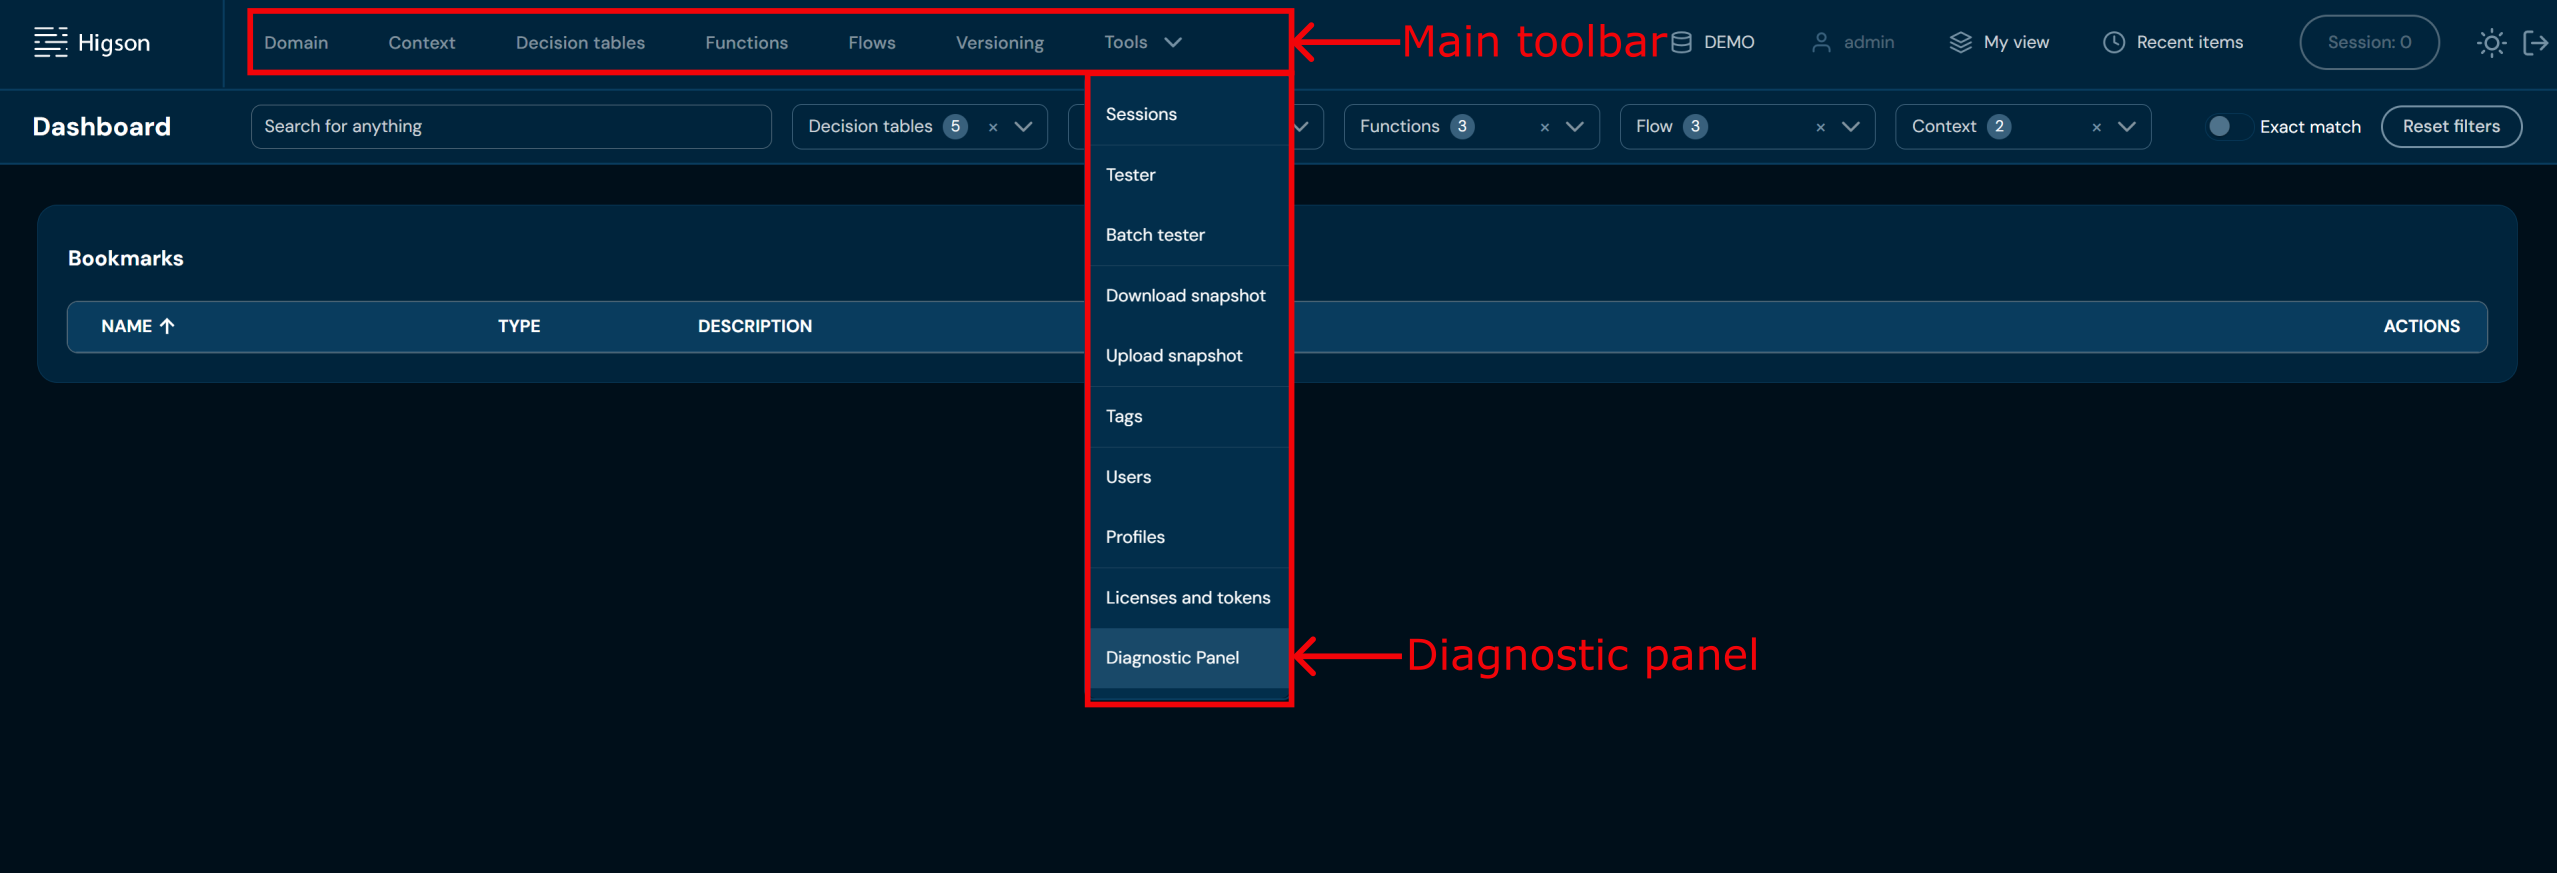
The Diagnostic Panel is accessible from the main Higson Studio menu Tools → Diagnostic panel:
After clicking, the interface switches to the diagnostic panel with its own tabs. The panel opens with the default Profilers tab
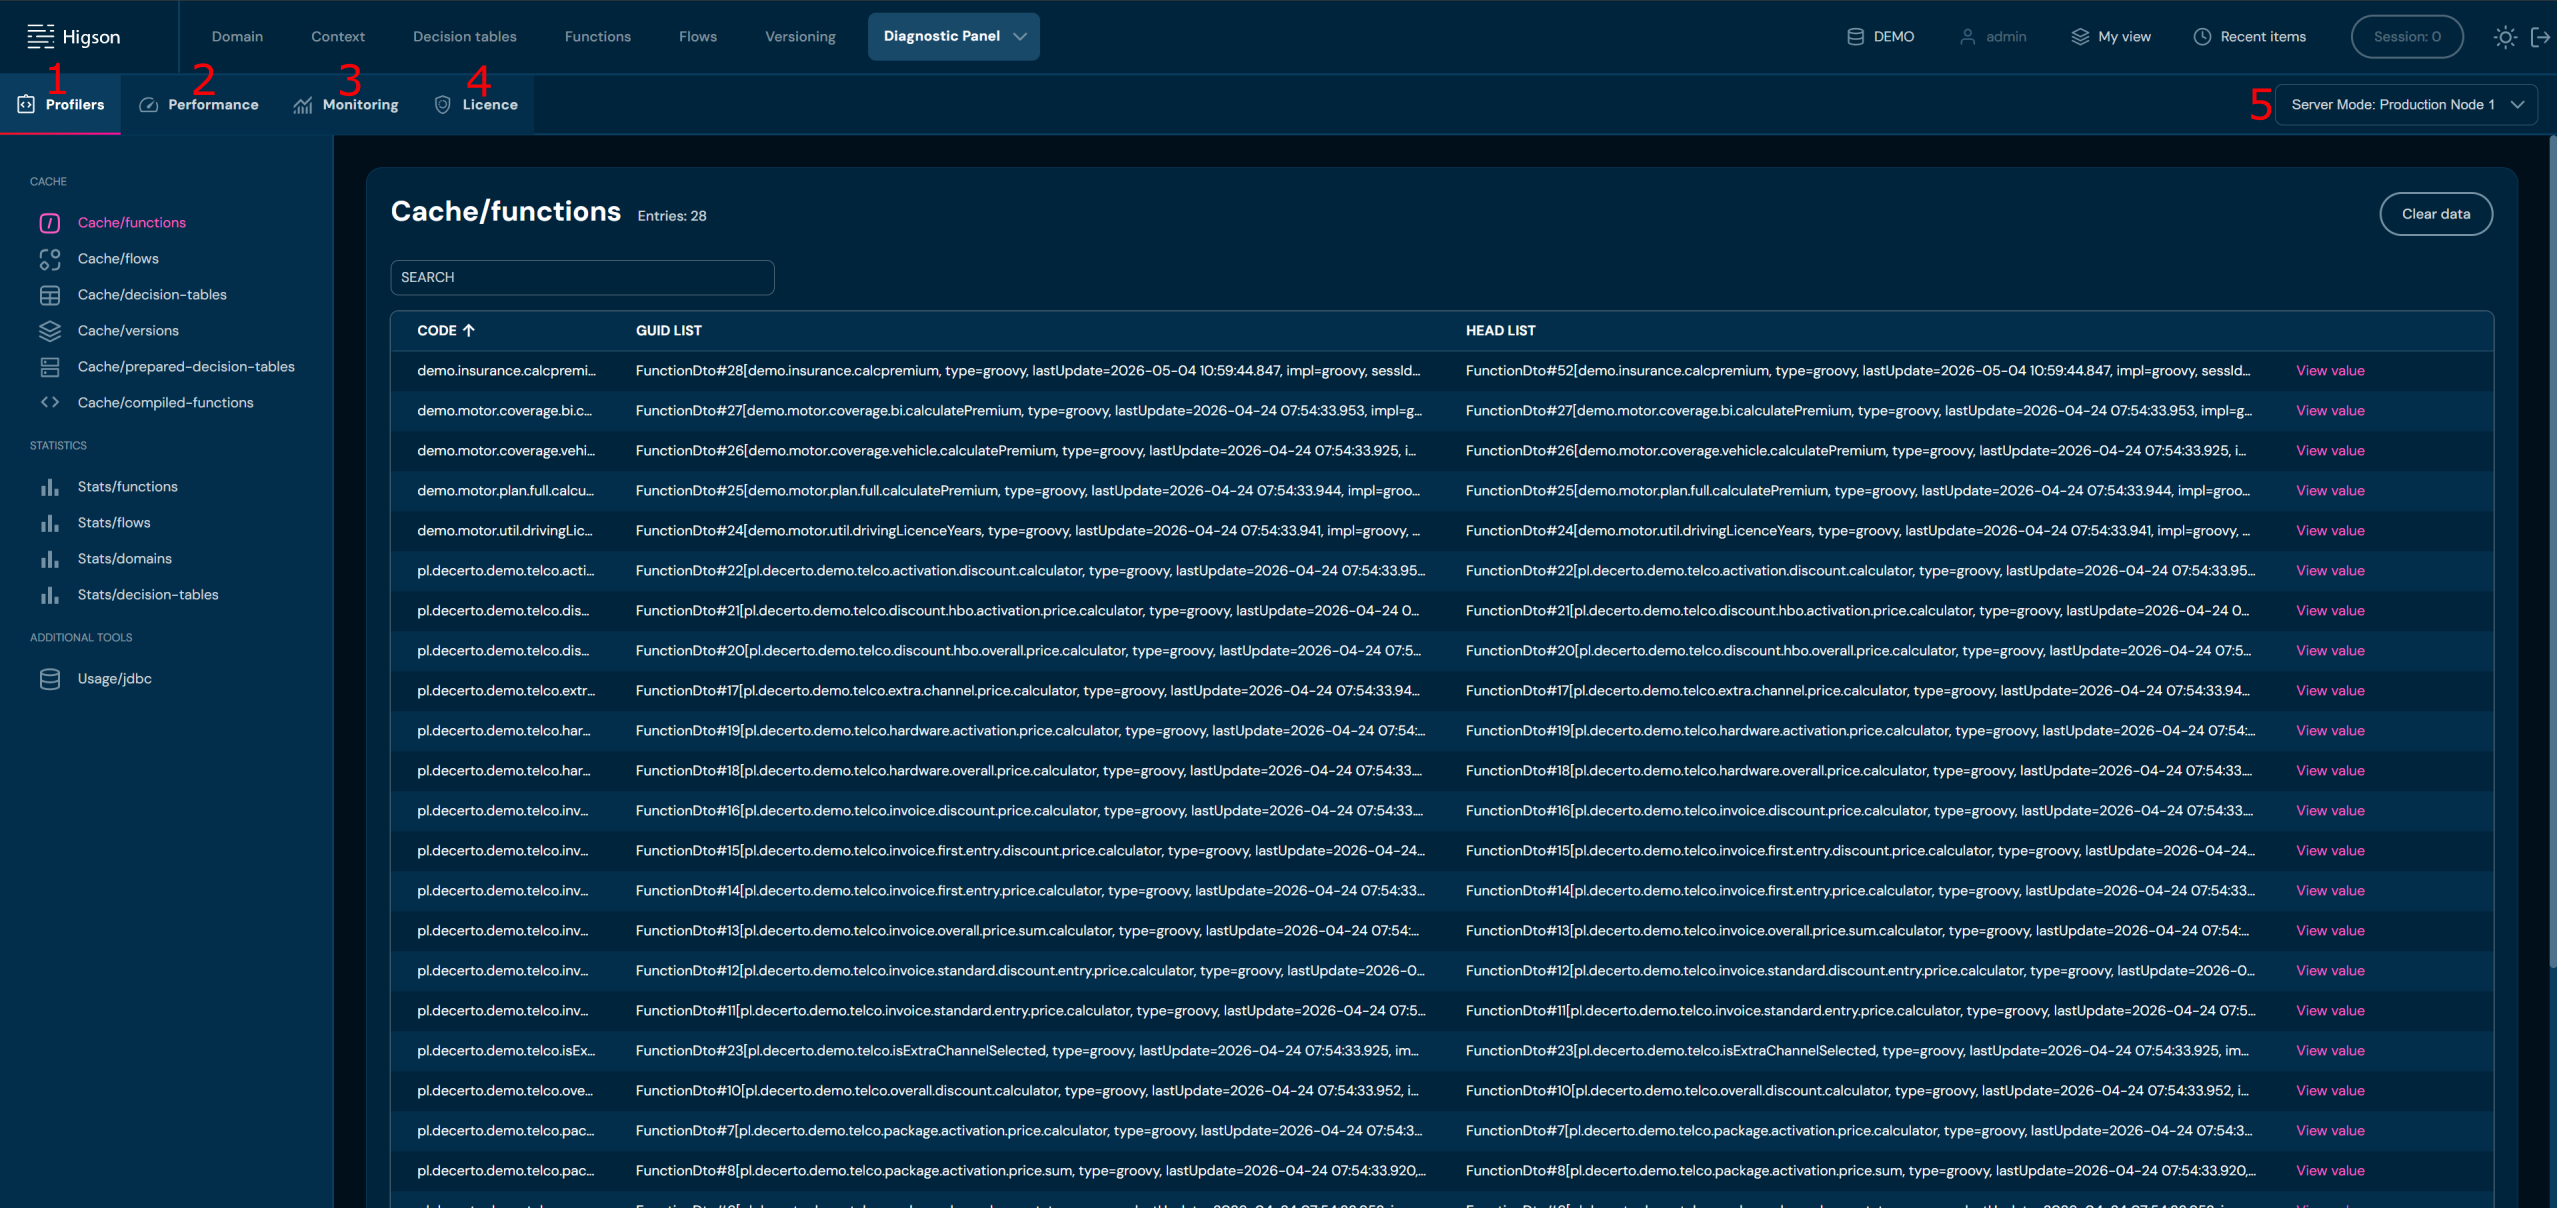
| No. | Name | Description |
|---|---|---|
| 1. | Profilers | The Profilers tab is used for inspecting cache and call statistics. |
| 2. | Performance | The Performance tab records a detailed history of business rule executions in the system. |
| 3. | Monitoring | The Monitoring tab provides real-time server resource monitoring. |
| 4. | Licence | The Licence tab provides full insight into the Higson licence status. |
| 5. | Server Mode Selector | The Server Mode selector which allows you to switch between different nodes in the Higson cluster. All data displayed in the panel relates to the selected node. |
The Server Mode selector which allows you to switch between different nodes in the Higson cluster. All data displayed in the panel relates to the selected node.
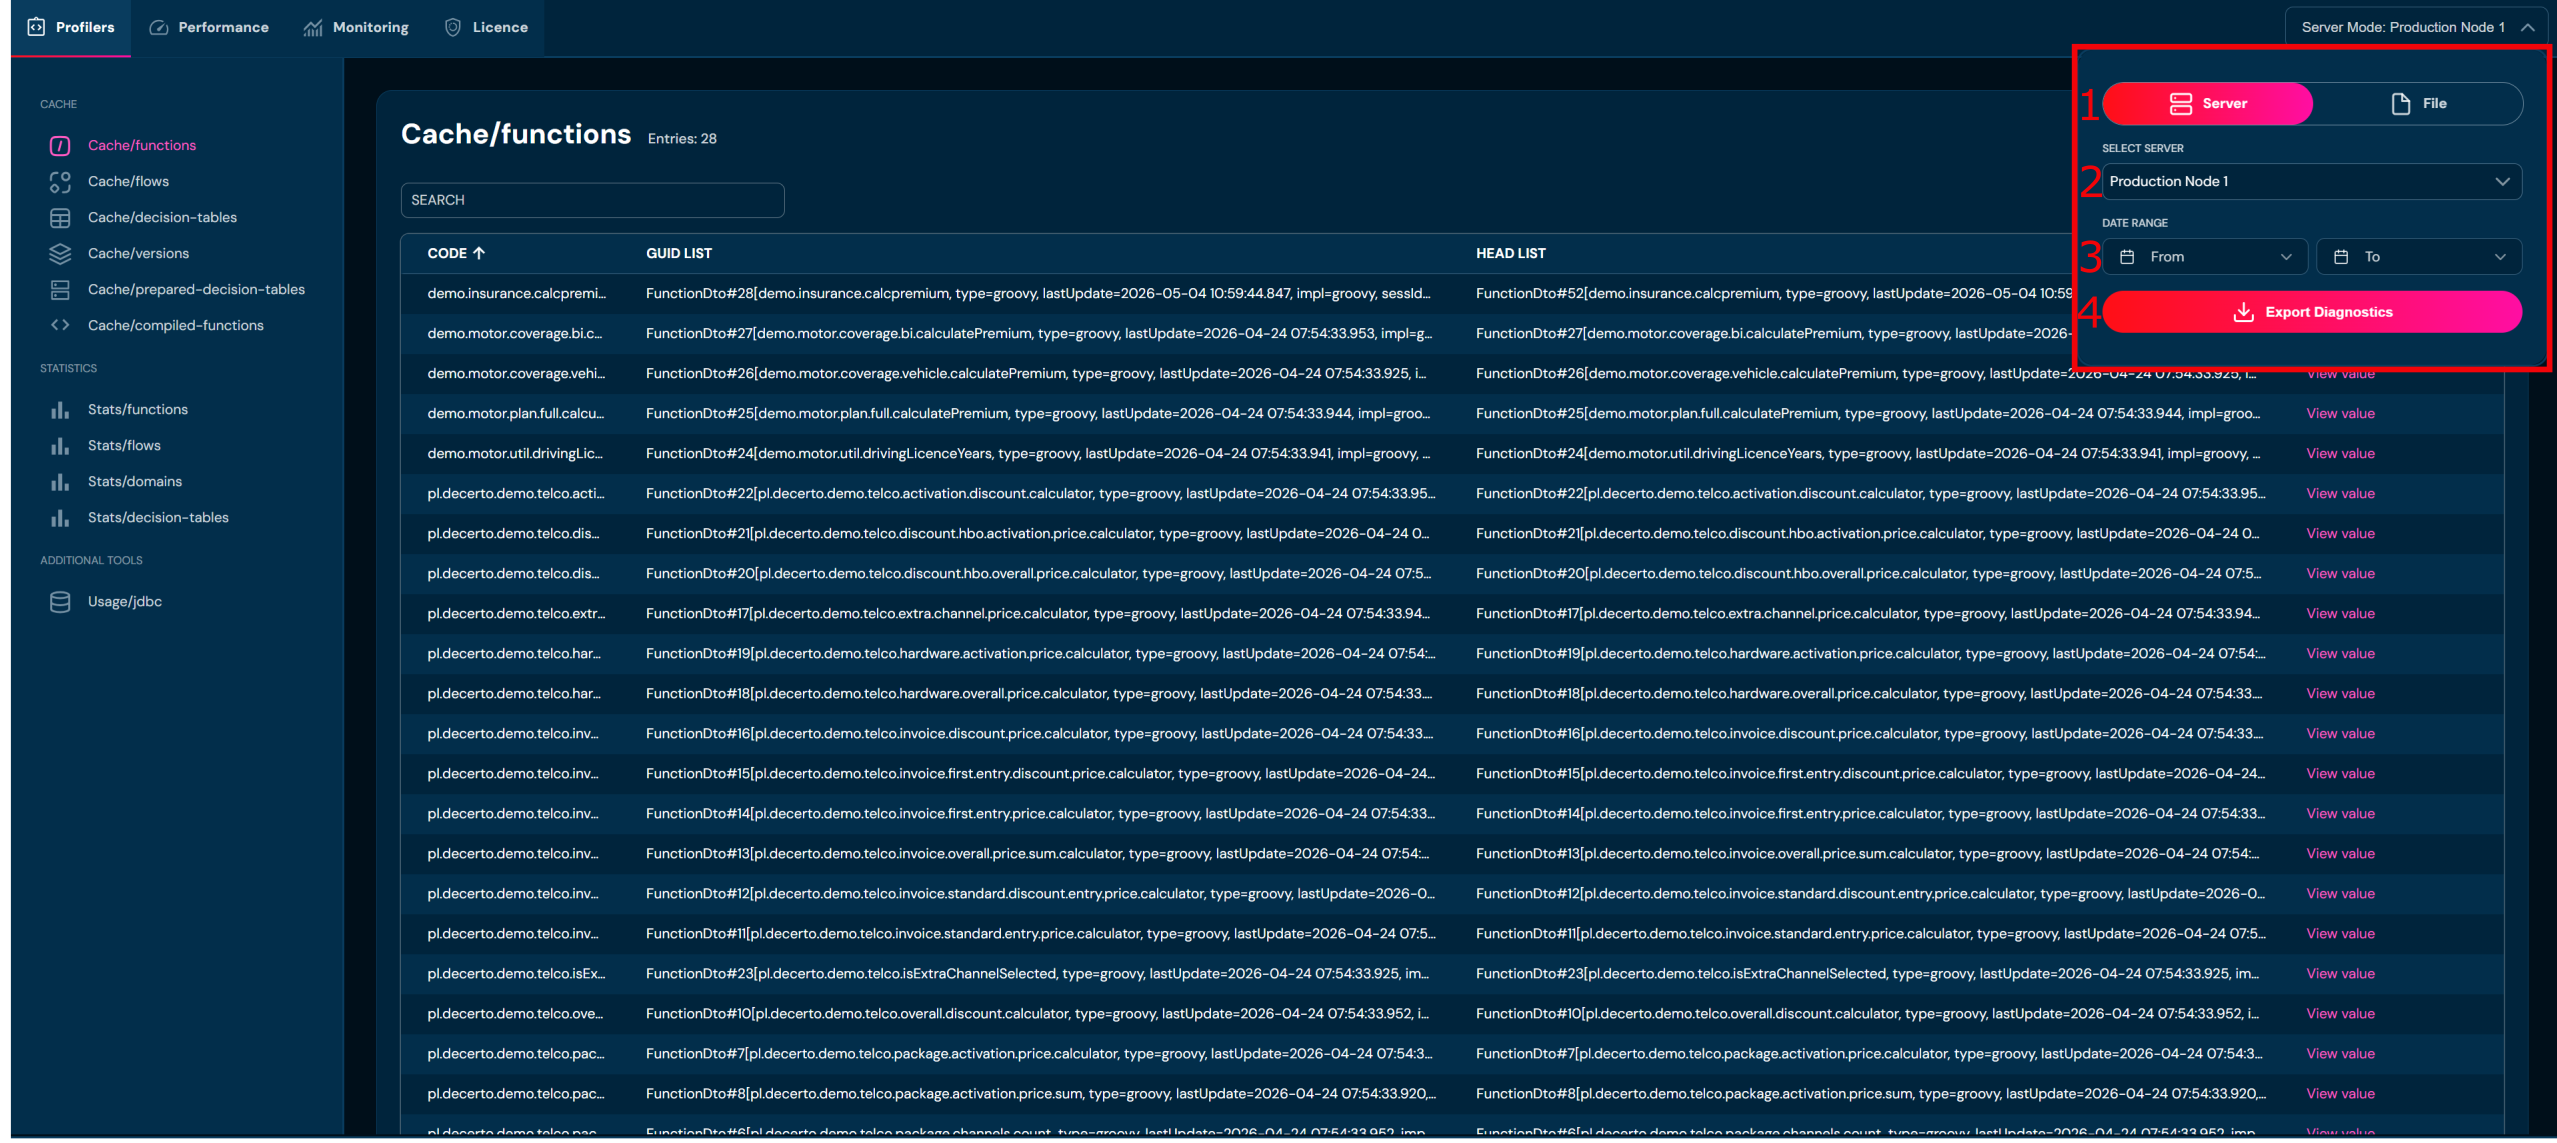
To select the data for analysis, click on Server Mode Selector and then:
- Select the data source. The selector operates in two modes:
- Server Mode — data from a selected node, with the option to filter by date range (the ‘From’ / ‘To’ fields)
- File Mode — data from a previously exported diagnostic file (.hdiag), for offline analysis
- Select the date range
- Select the node.
- Click Select to confirm.
Export#
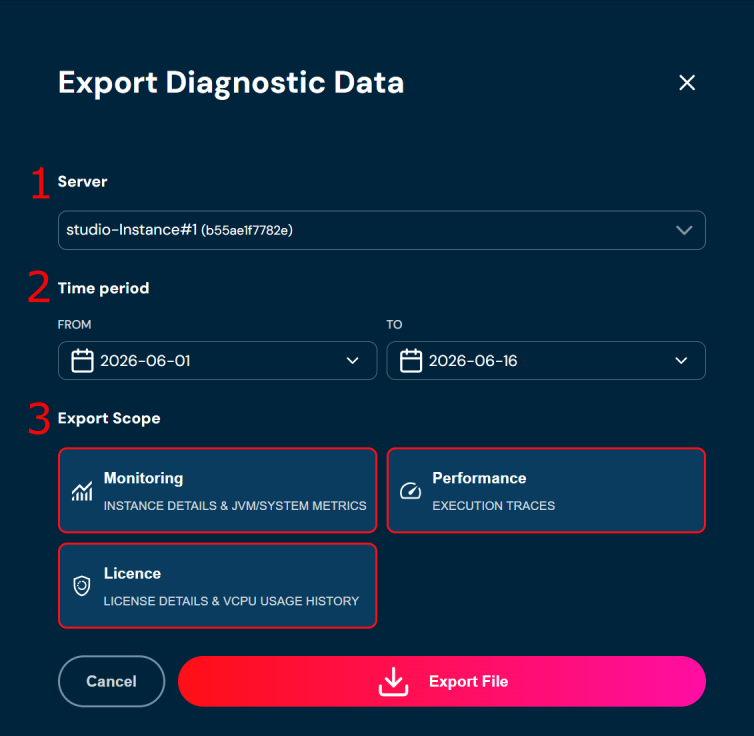
To export data, click on Selector and then Export. A pop-up window will open, in which you should:
- Select the date range.
- Select the node.
- Select the export scope.
Profilers Tab#
higson.runtime.diagnostic.profiler.enabled property reduces runtime performance. Keep this in mind if you decide to enable diagnostics in the environment.
The Profilers tab is used for inspecting the internal data structures of the Higson engine — primarily the cache contents and call statistics. It helps answer questions such as: “what is currently in the cache?”, “how many times has a given rule been called?” and “what SQL queries are being generated?”.
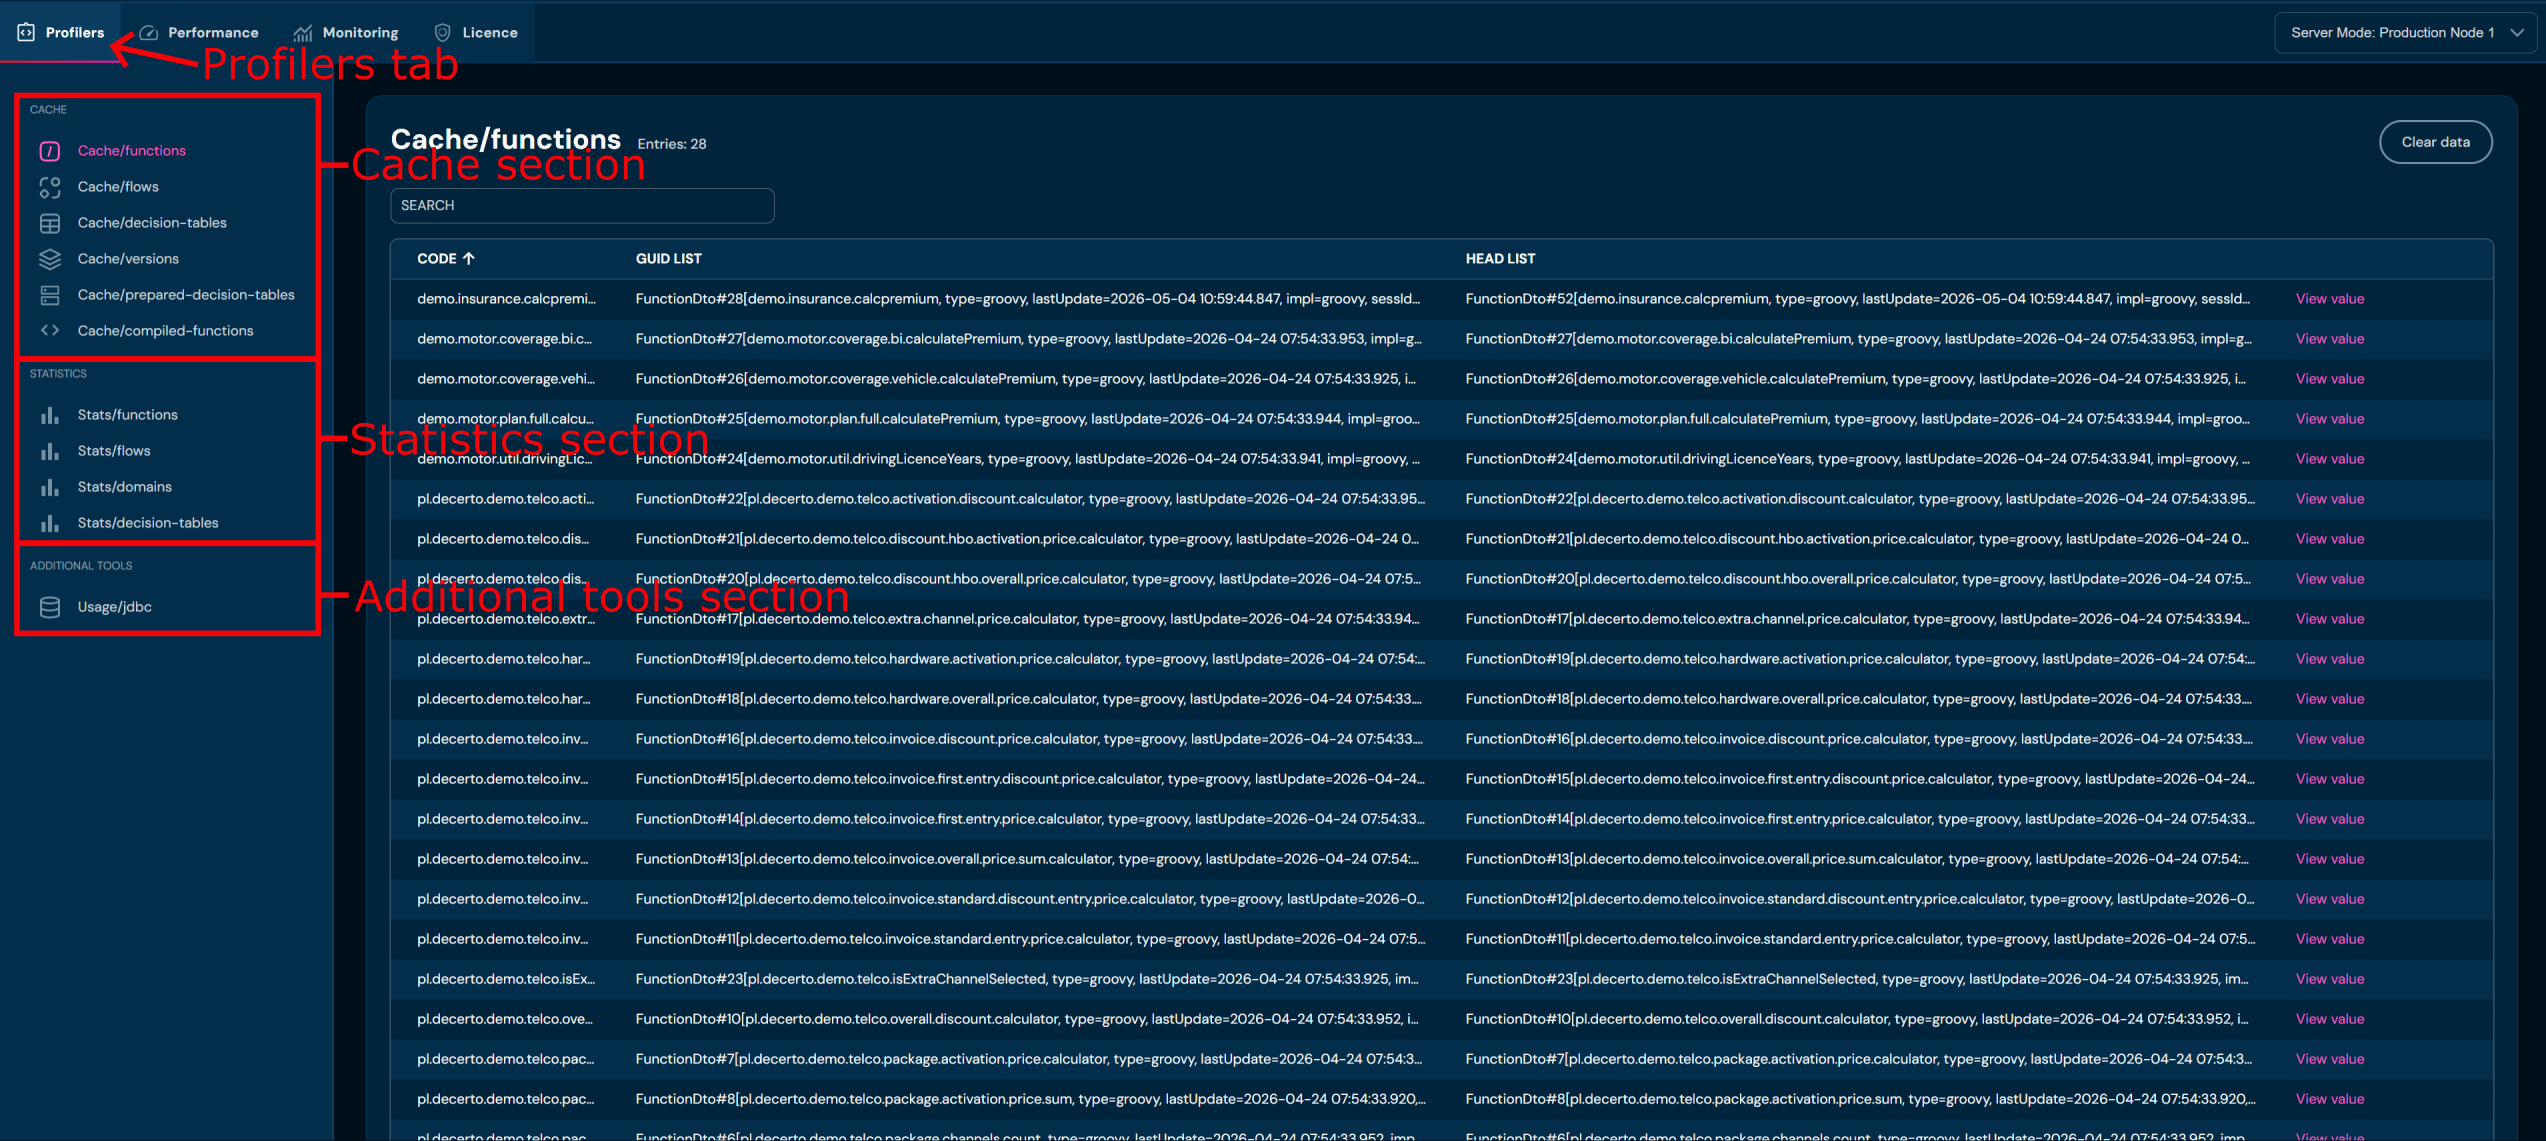
The side menu (left navigation panel) divides the tab into three sections: CACHE, STATISTICS, and ADDITIONAL TOOLS.
CACHE Section#
The CACHE section allows viewing the current contents of the Higson engine’s cache. Each subpage displays a different type of cached object.
Cache/functions#
Displays a list of all functions currently stored in the engine’s cache.
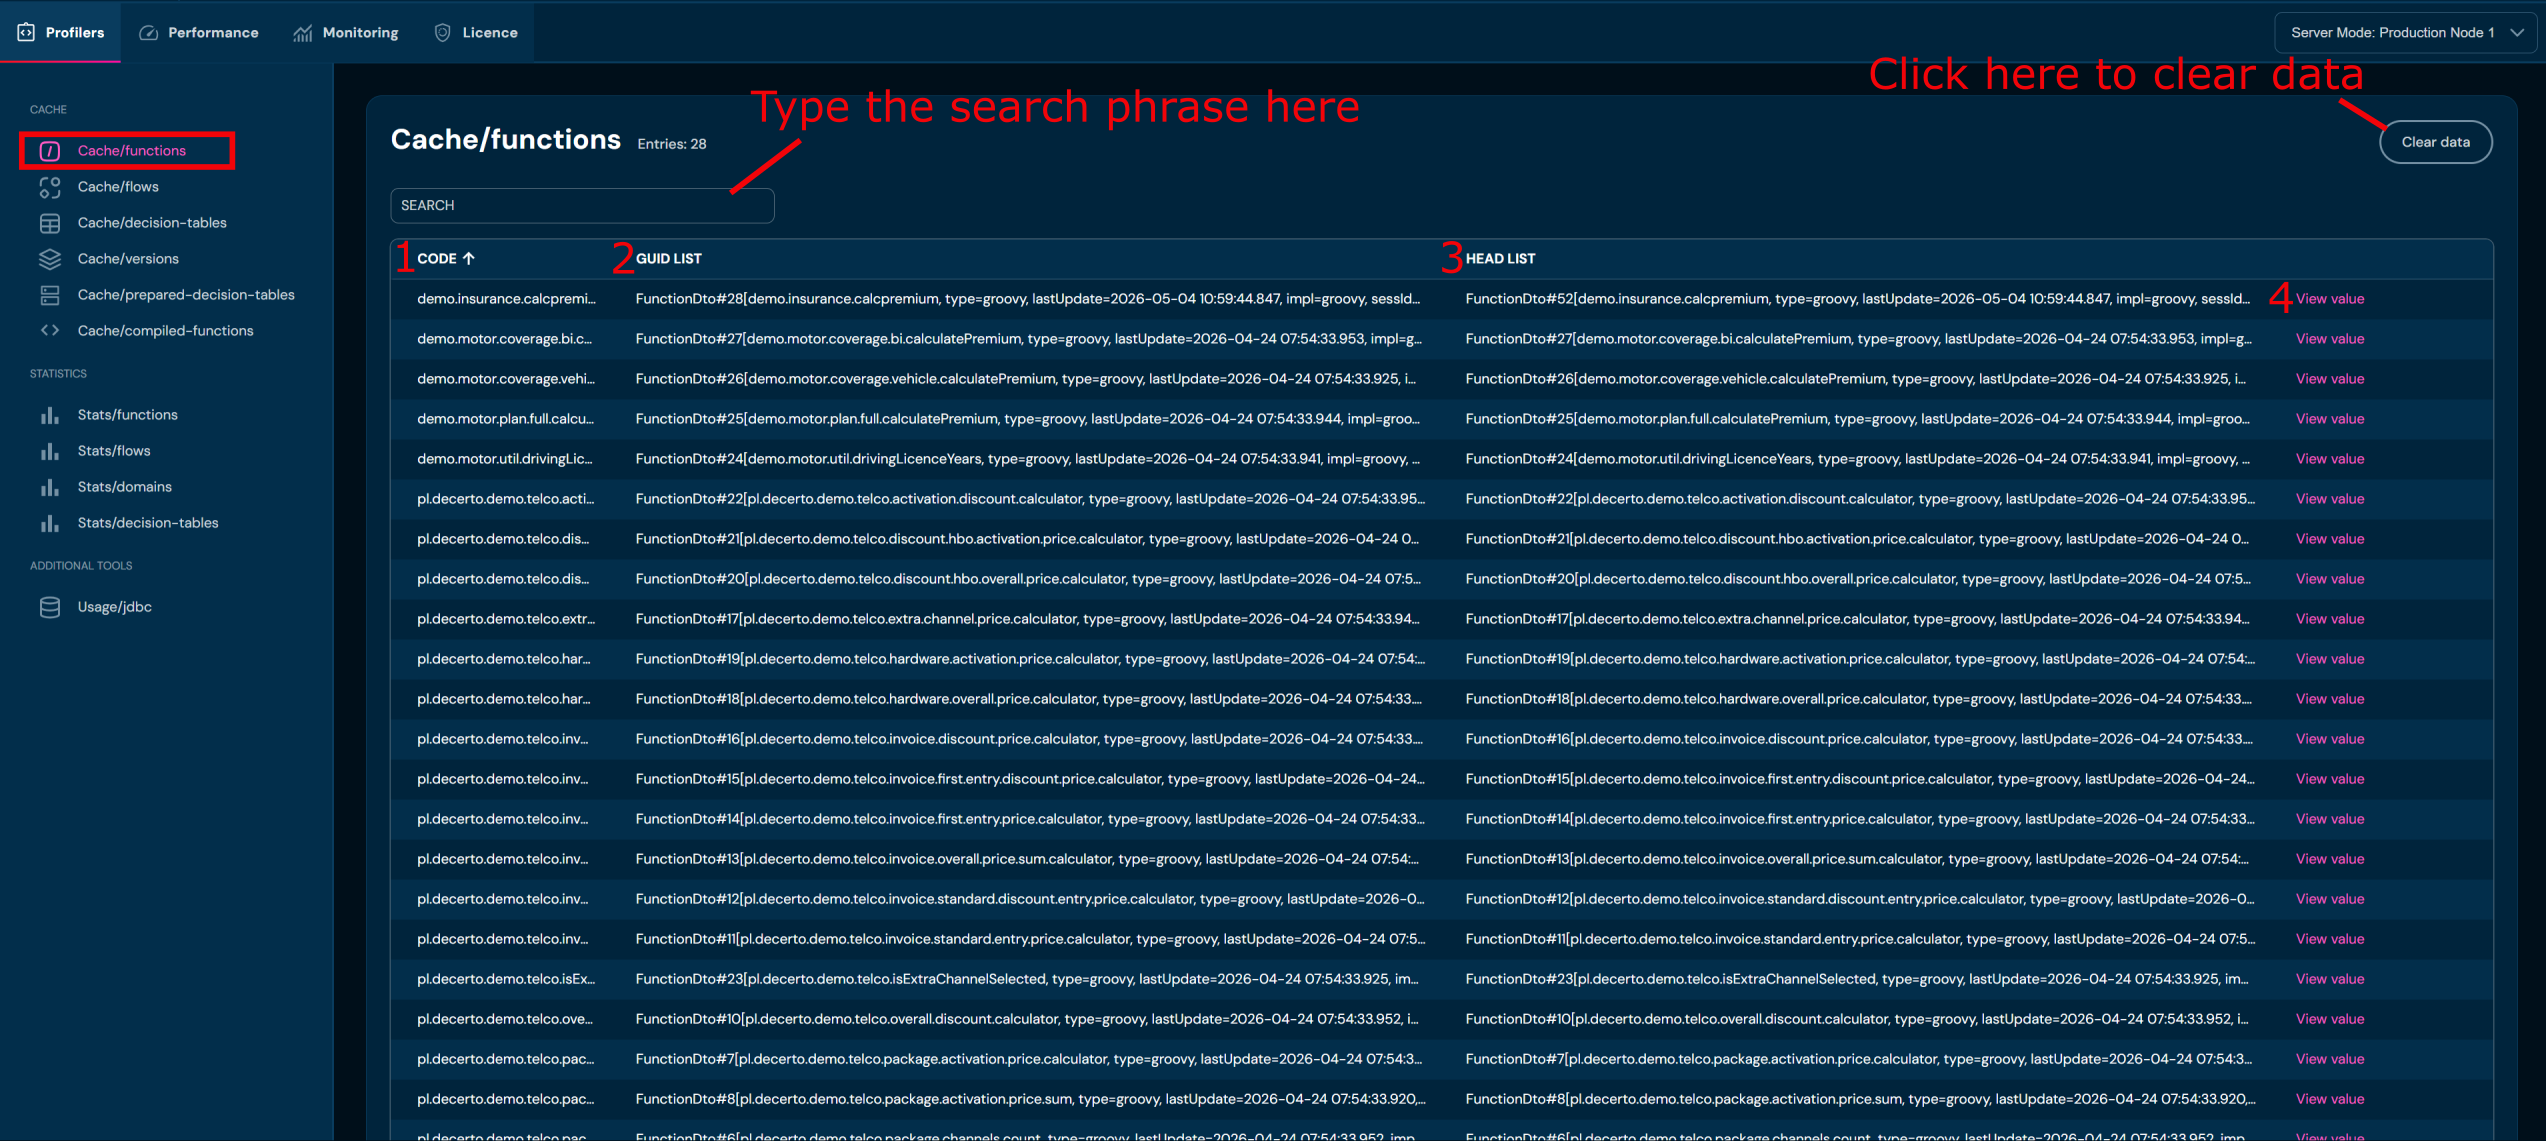
| No. | Column/Action Name | Description |
|---|---|---|
| 1. | Code | Code of the function. |
| 2. | GUID List | Cache version identifier of the function with metadata: language type (python/groovy), last update date, session ID. |
| 3. | Head List | Identifier of the newest (main) version of the function — comparison with GUID List allows detecting outdated versions. |
| 4. | View value | Link to view the full cache entry value (FunctionDto object details). |
Use cases:
- Verifying whether a given function is correctly loaded into the cache
- Checking the function version (whether HEAD matches GUID — no discrepancy)
- Identifying language types (Python vs Groovy) in the system
- Diagnosing function update problems (comparing
lastUpdatedates)
Cache/flows#
Displays a list of flows stored in the cache. Flows are complex business processes consisting of multiple steps, combining function calls and decision tables.
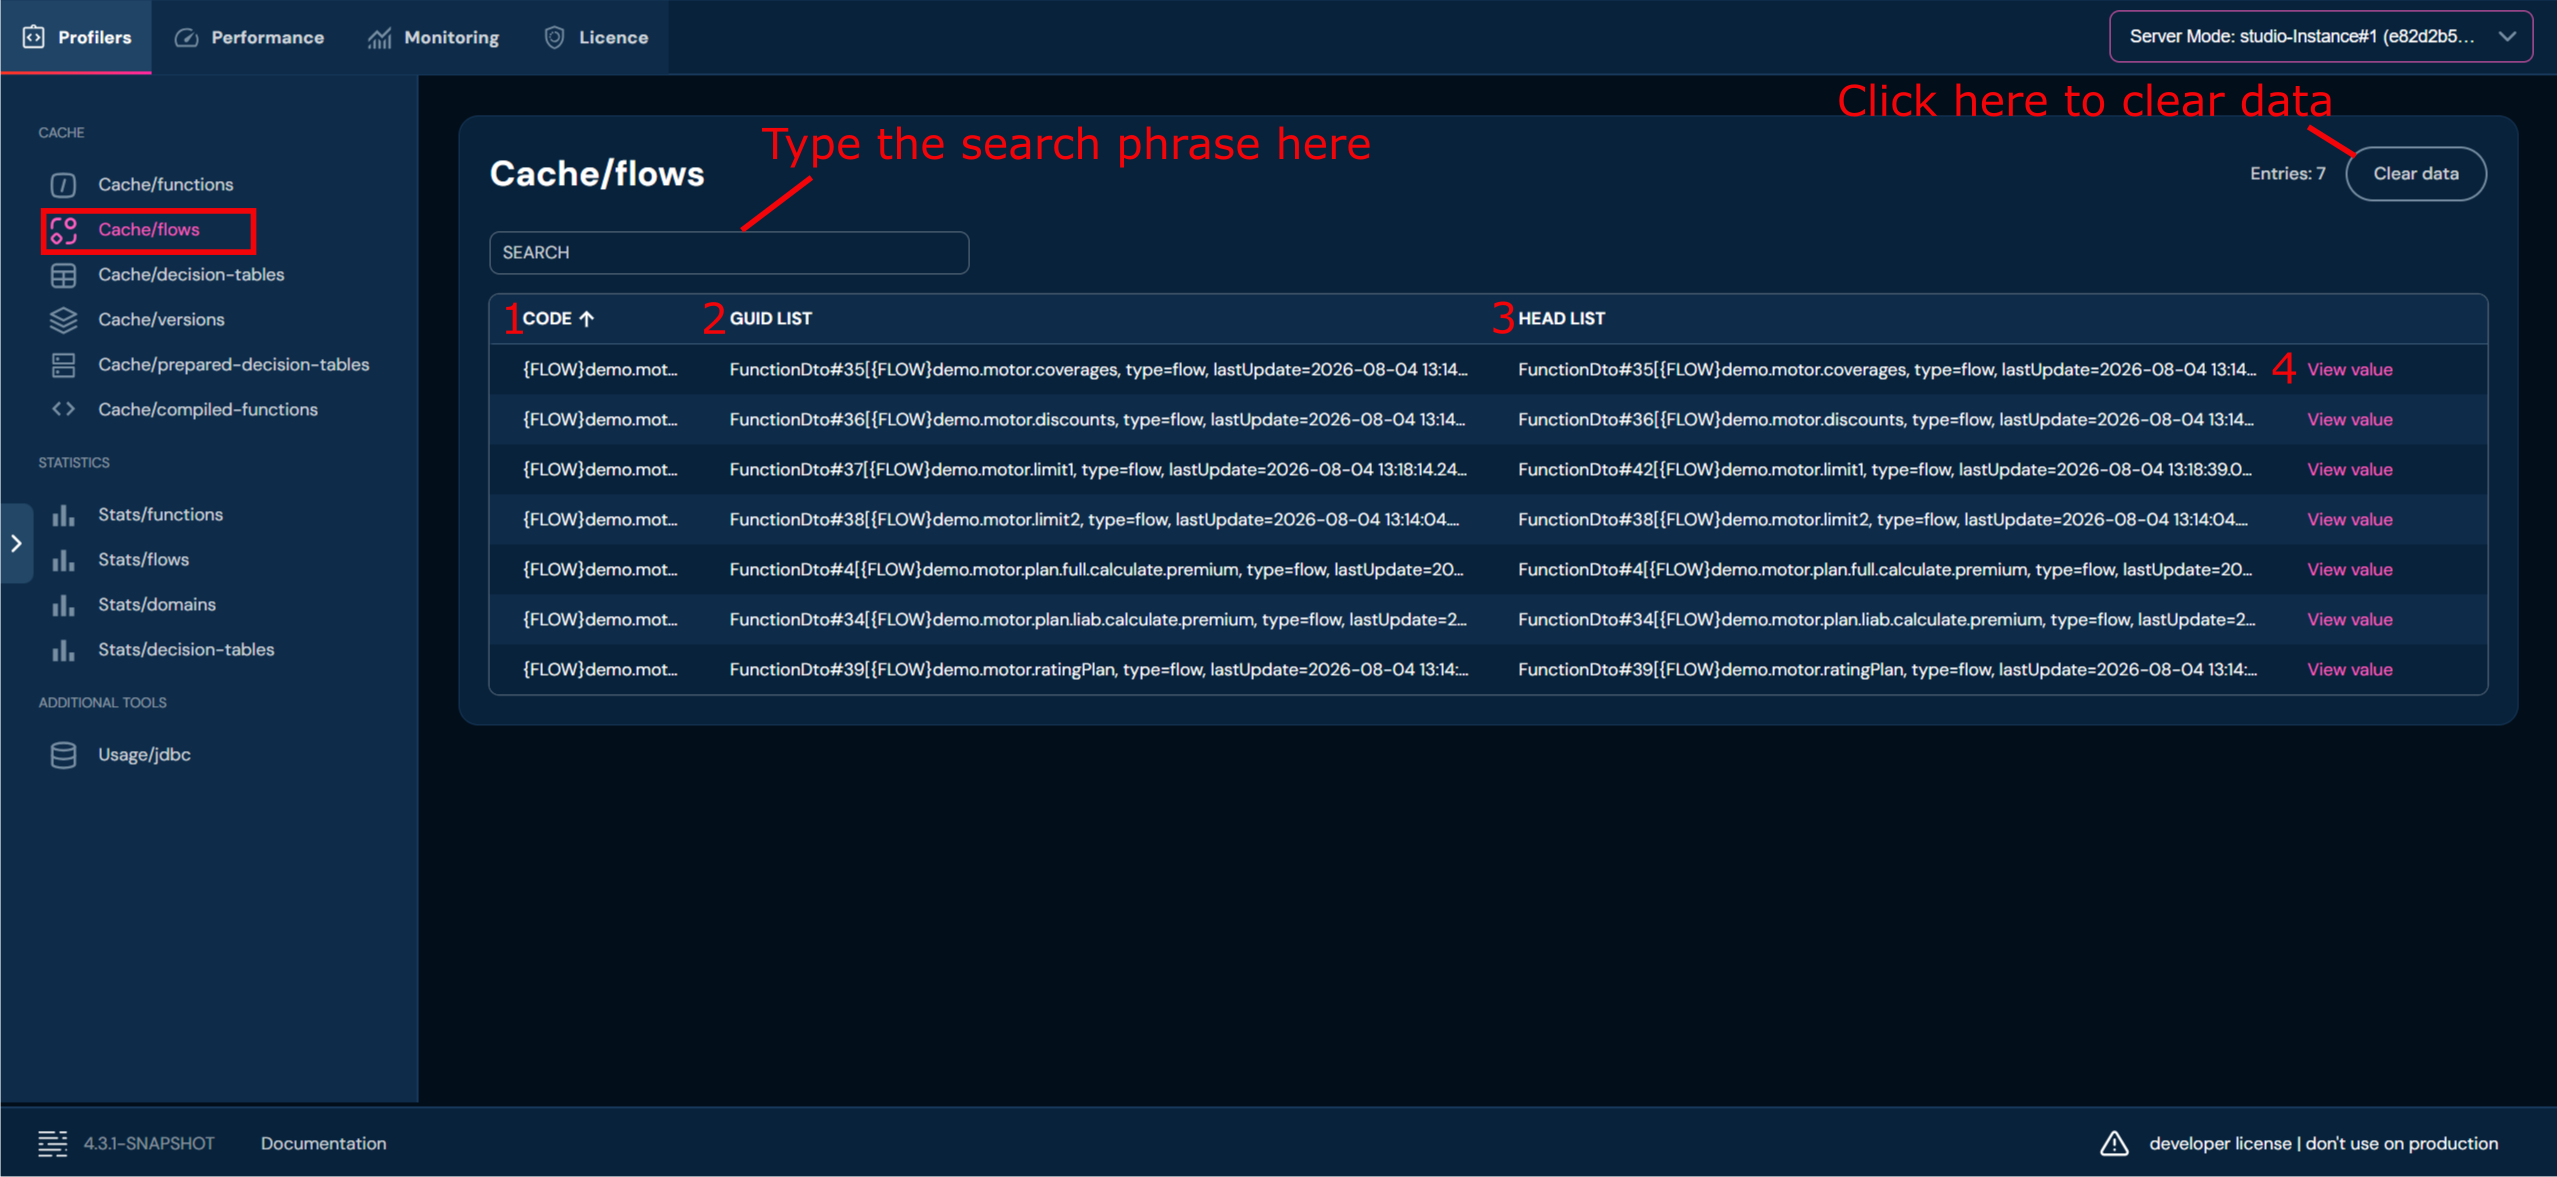
| No. | Column/Action Name | Description |
|---|---|---|
| 1. | Code | Unique flow code (name). |
| 2. | GUID List | Cache version identifier of the flow with metadata (update date, session ID). |
| 3. | Head List | Identifier of the newest flow version. |
| 4. | View value | Link to view the full cache entry value. |
Use cases:
- Verifying flow presence in the cache after deployment
- Checking whether the GUID version matches HEAD
- Diagnosing flow execution problems
Cache/decision-tables#
Displays decision tables stored in the cache. Decision tables are a key element of the Higson engine — they define business rules in tabular form.
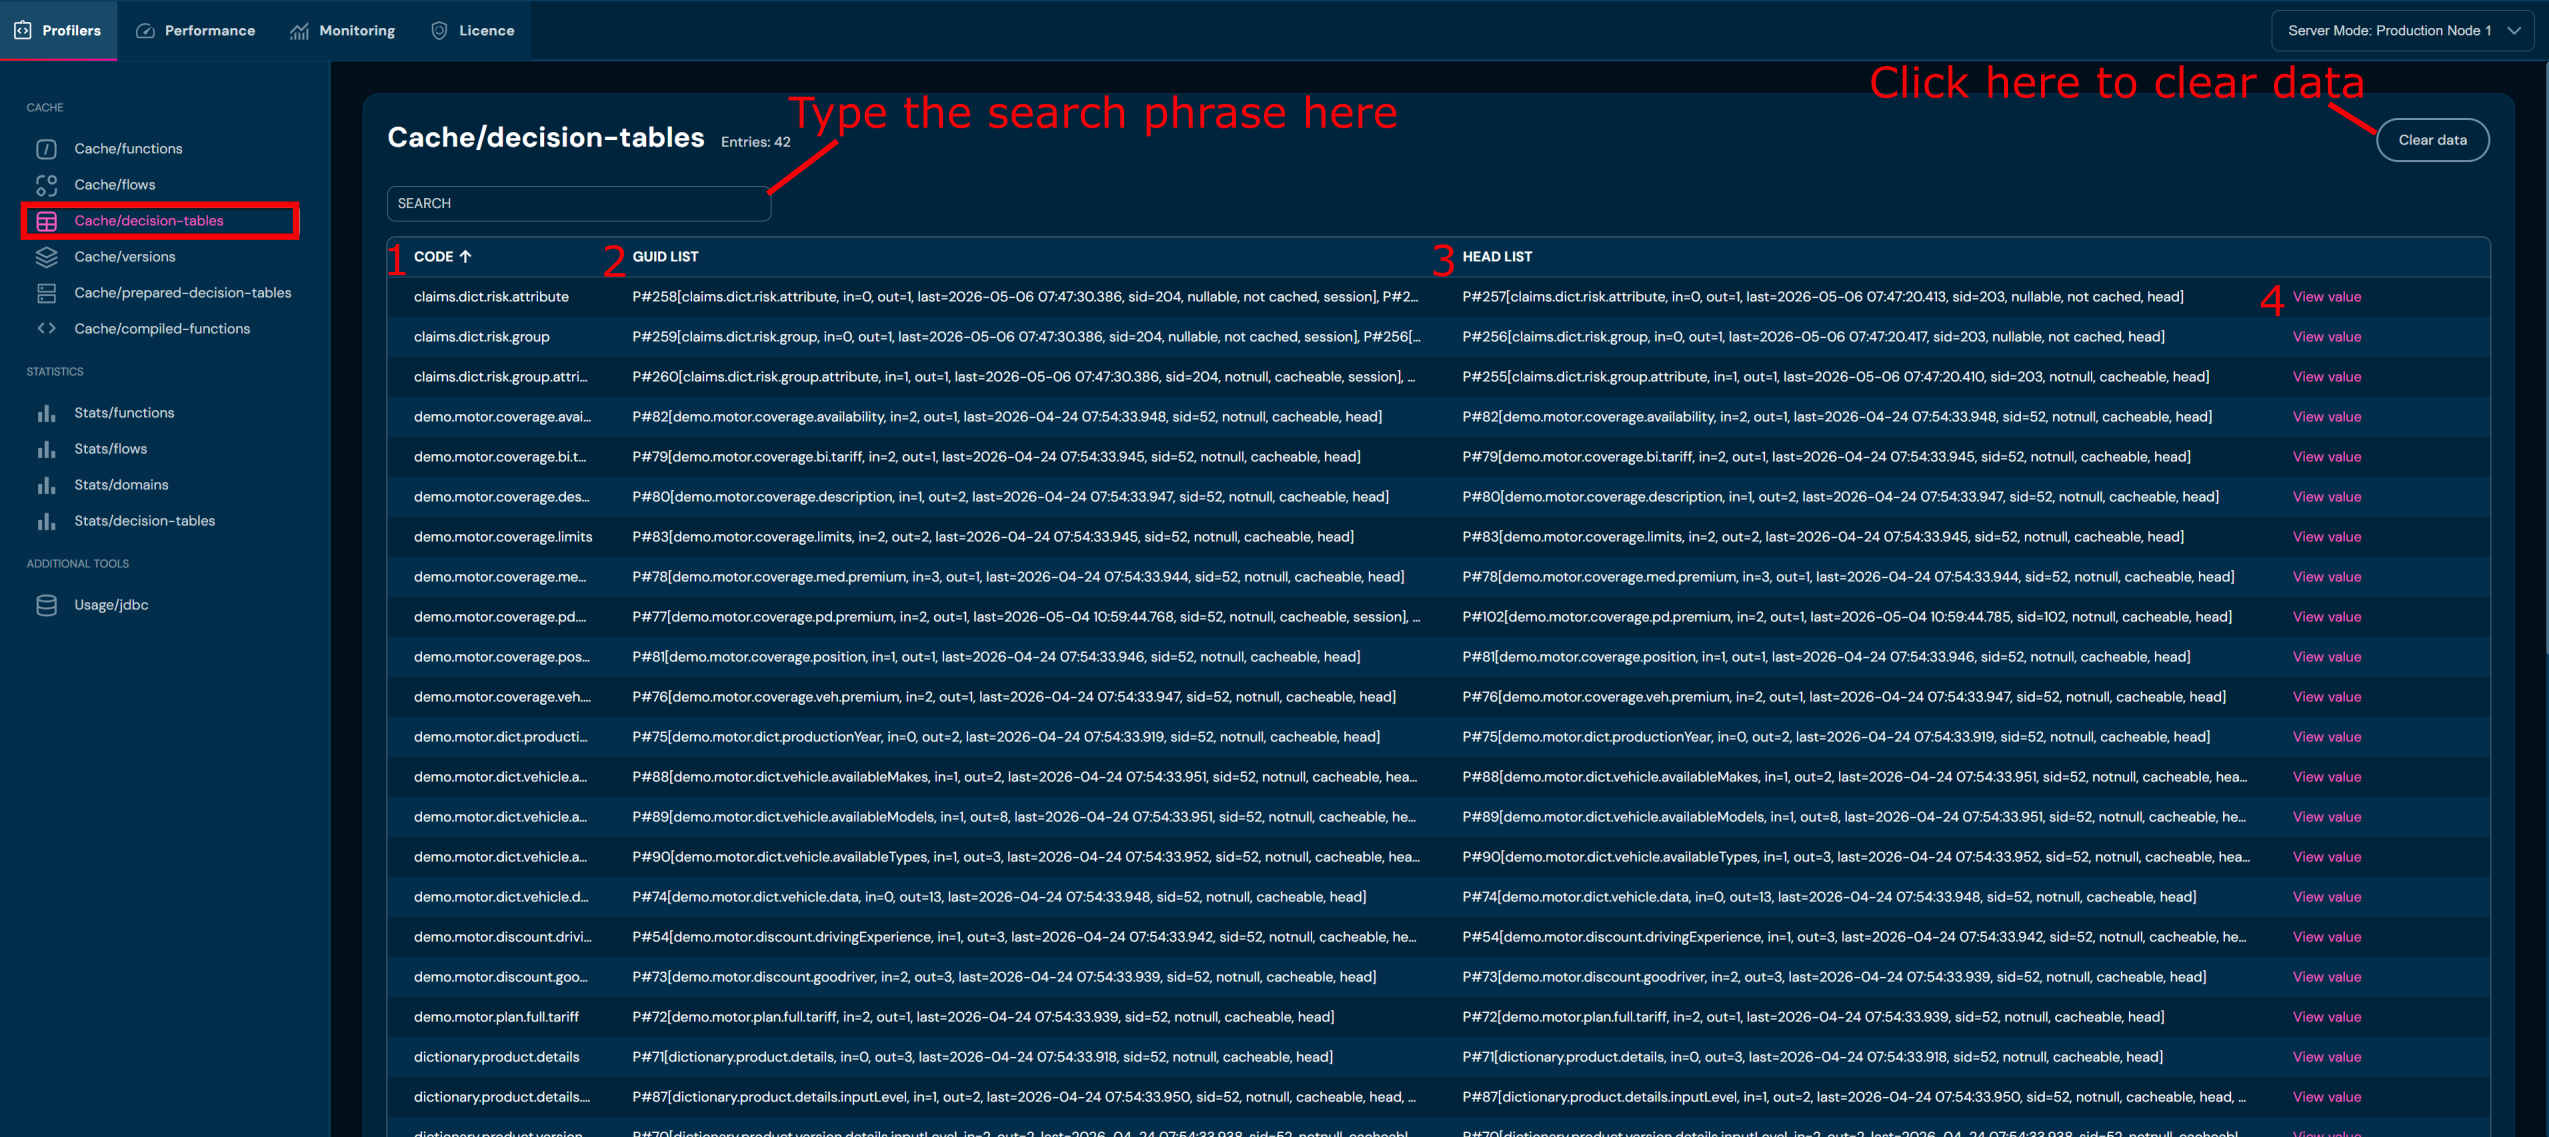
| No. | Column/Action Name | Description |
|---|---|---|
| 1. | Code | Decision table name (e.g., demo.motor.coverage.availability). |
| 2. | GUID List | Cache entry metadata with the number of input parameters (in=) and output parameters (out=), update date, session ID. |
| 3. | Head List | The newest version of the table in cache. |
| 4. | View value | Link to view the full cache entry value. |
Use cases:
- Verifying that decision tables are correctly loaded
- Checking table parameters (in/out)
- Identifying tables with outdated versions
Cache/versions#
Displays cached versions of the Higson engine. Versions allow managing different rule variants.
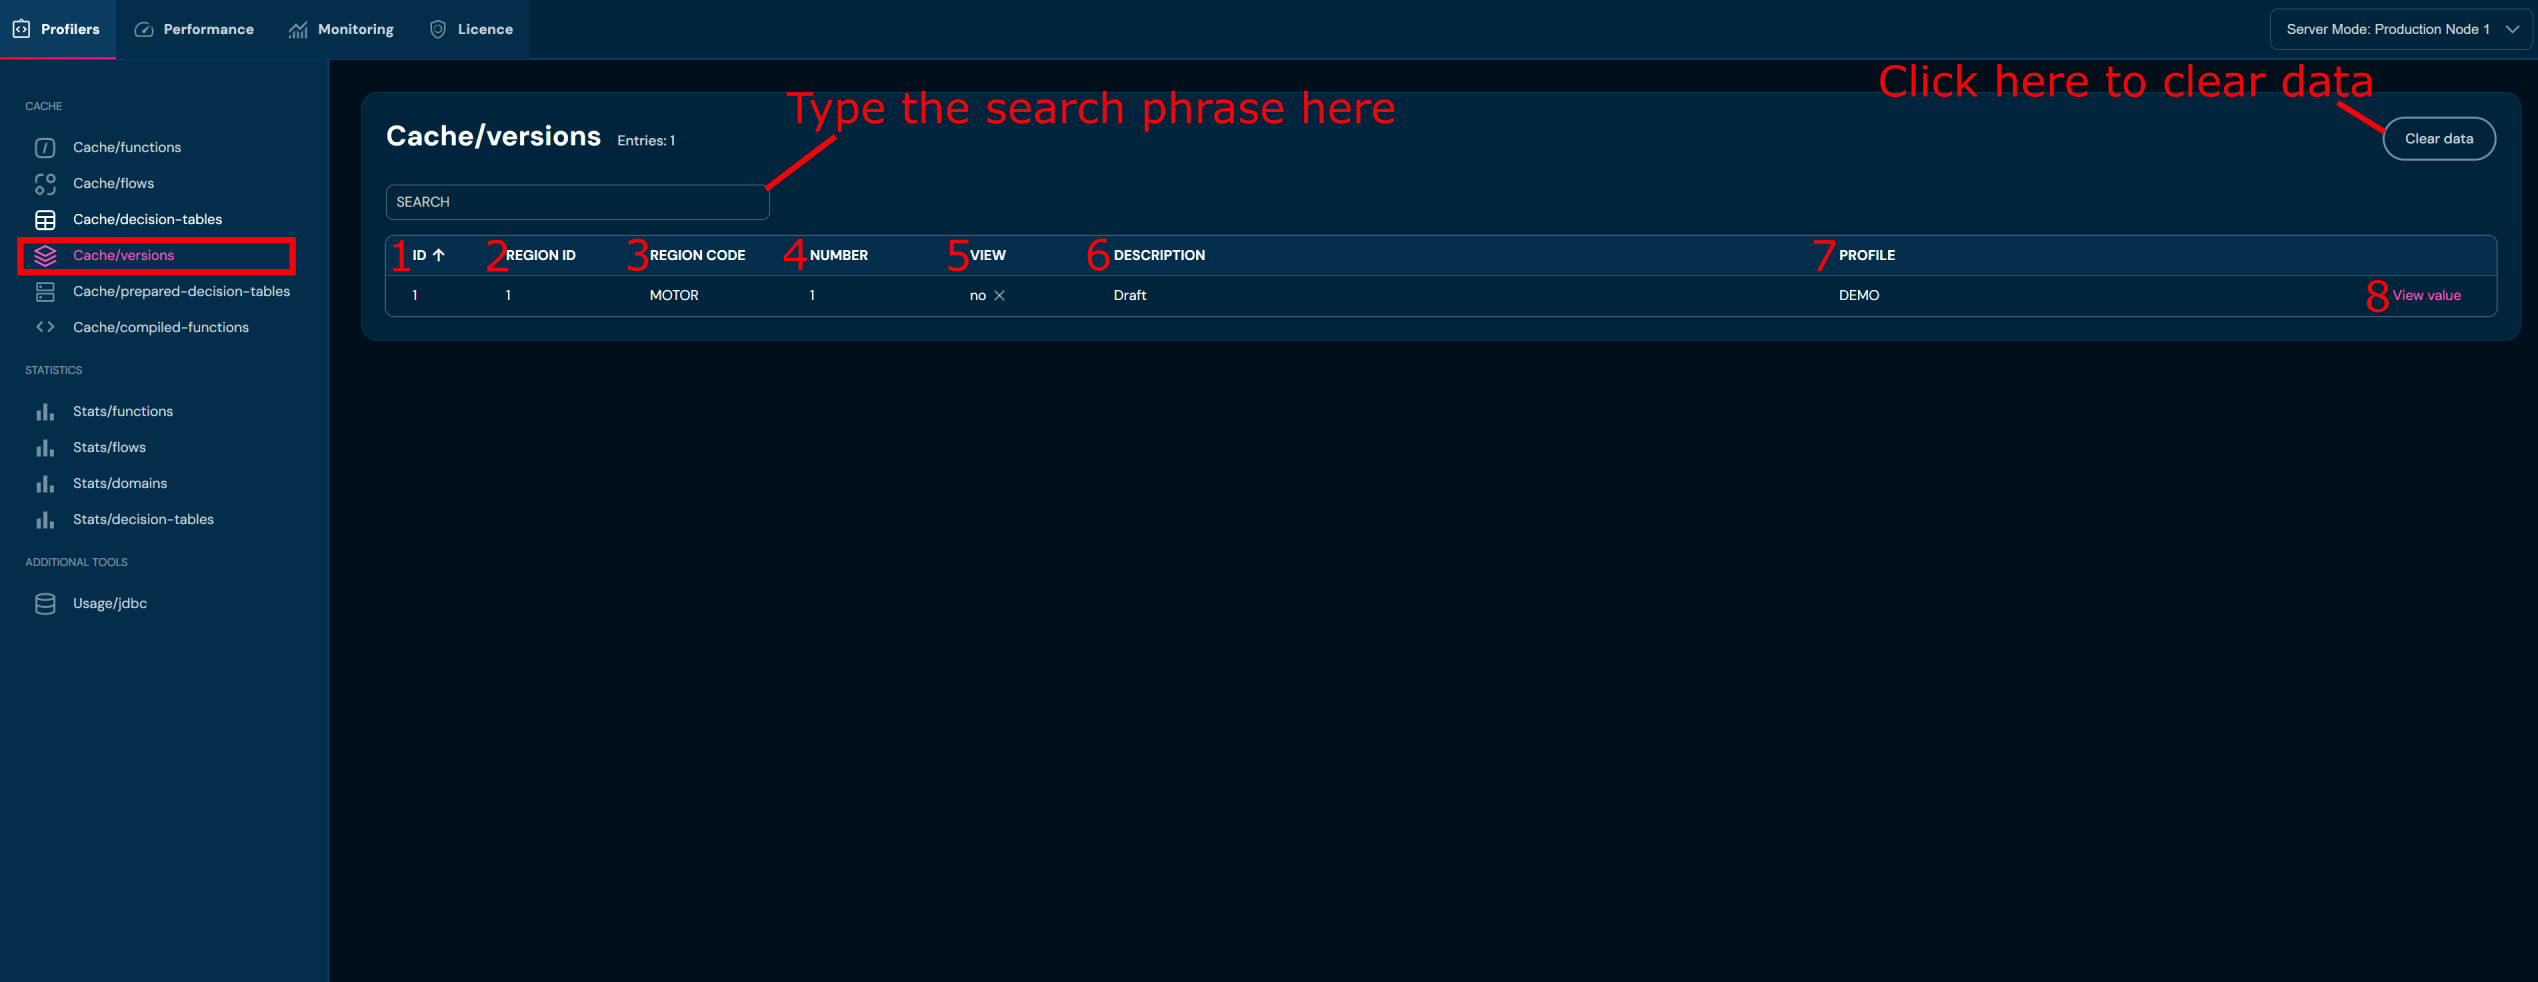
| No. | Column | Description |
|---|---|---|
| 1. | ID | Version identifier. |
| 2. | Region ID | ID of the region the version belongs to. |
| 3. | Region Code | Region code. |
| 4. | Number | Version number. |
| 5. | View | Indicates whether the version is a view (yes/no). |
| 6. | Description | Version description. |
| 7. | Profile | Profile associated with the region and version. |
| 8. | View value | Presents full values. |
Use cases:
- Verifying which configuration versions are currently loaded
- Checking the correctness of regions, views, and profiles
Cache/prepared-decision-tables#
Displays prepared decision tables — these are decision tables that have already been compiled and prepared for fast execution by the engine.
Unlike Cache/decision-tables (which shows the table definitions loaded into the cache), Cache/prepared-decision-tables shows the resulting compiled tables — with resolved input/output levels — ready for direct execution by the engine. A decision table may exist in Cache/decision-tables but not yet be prepared — it will appear here only after the first invocation.
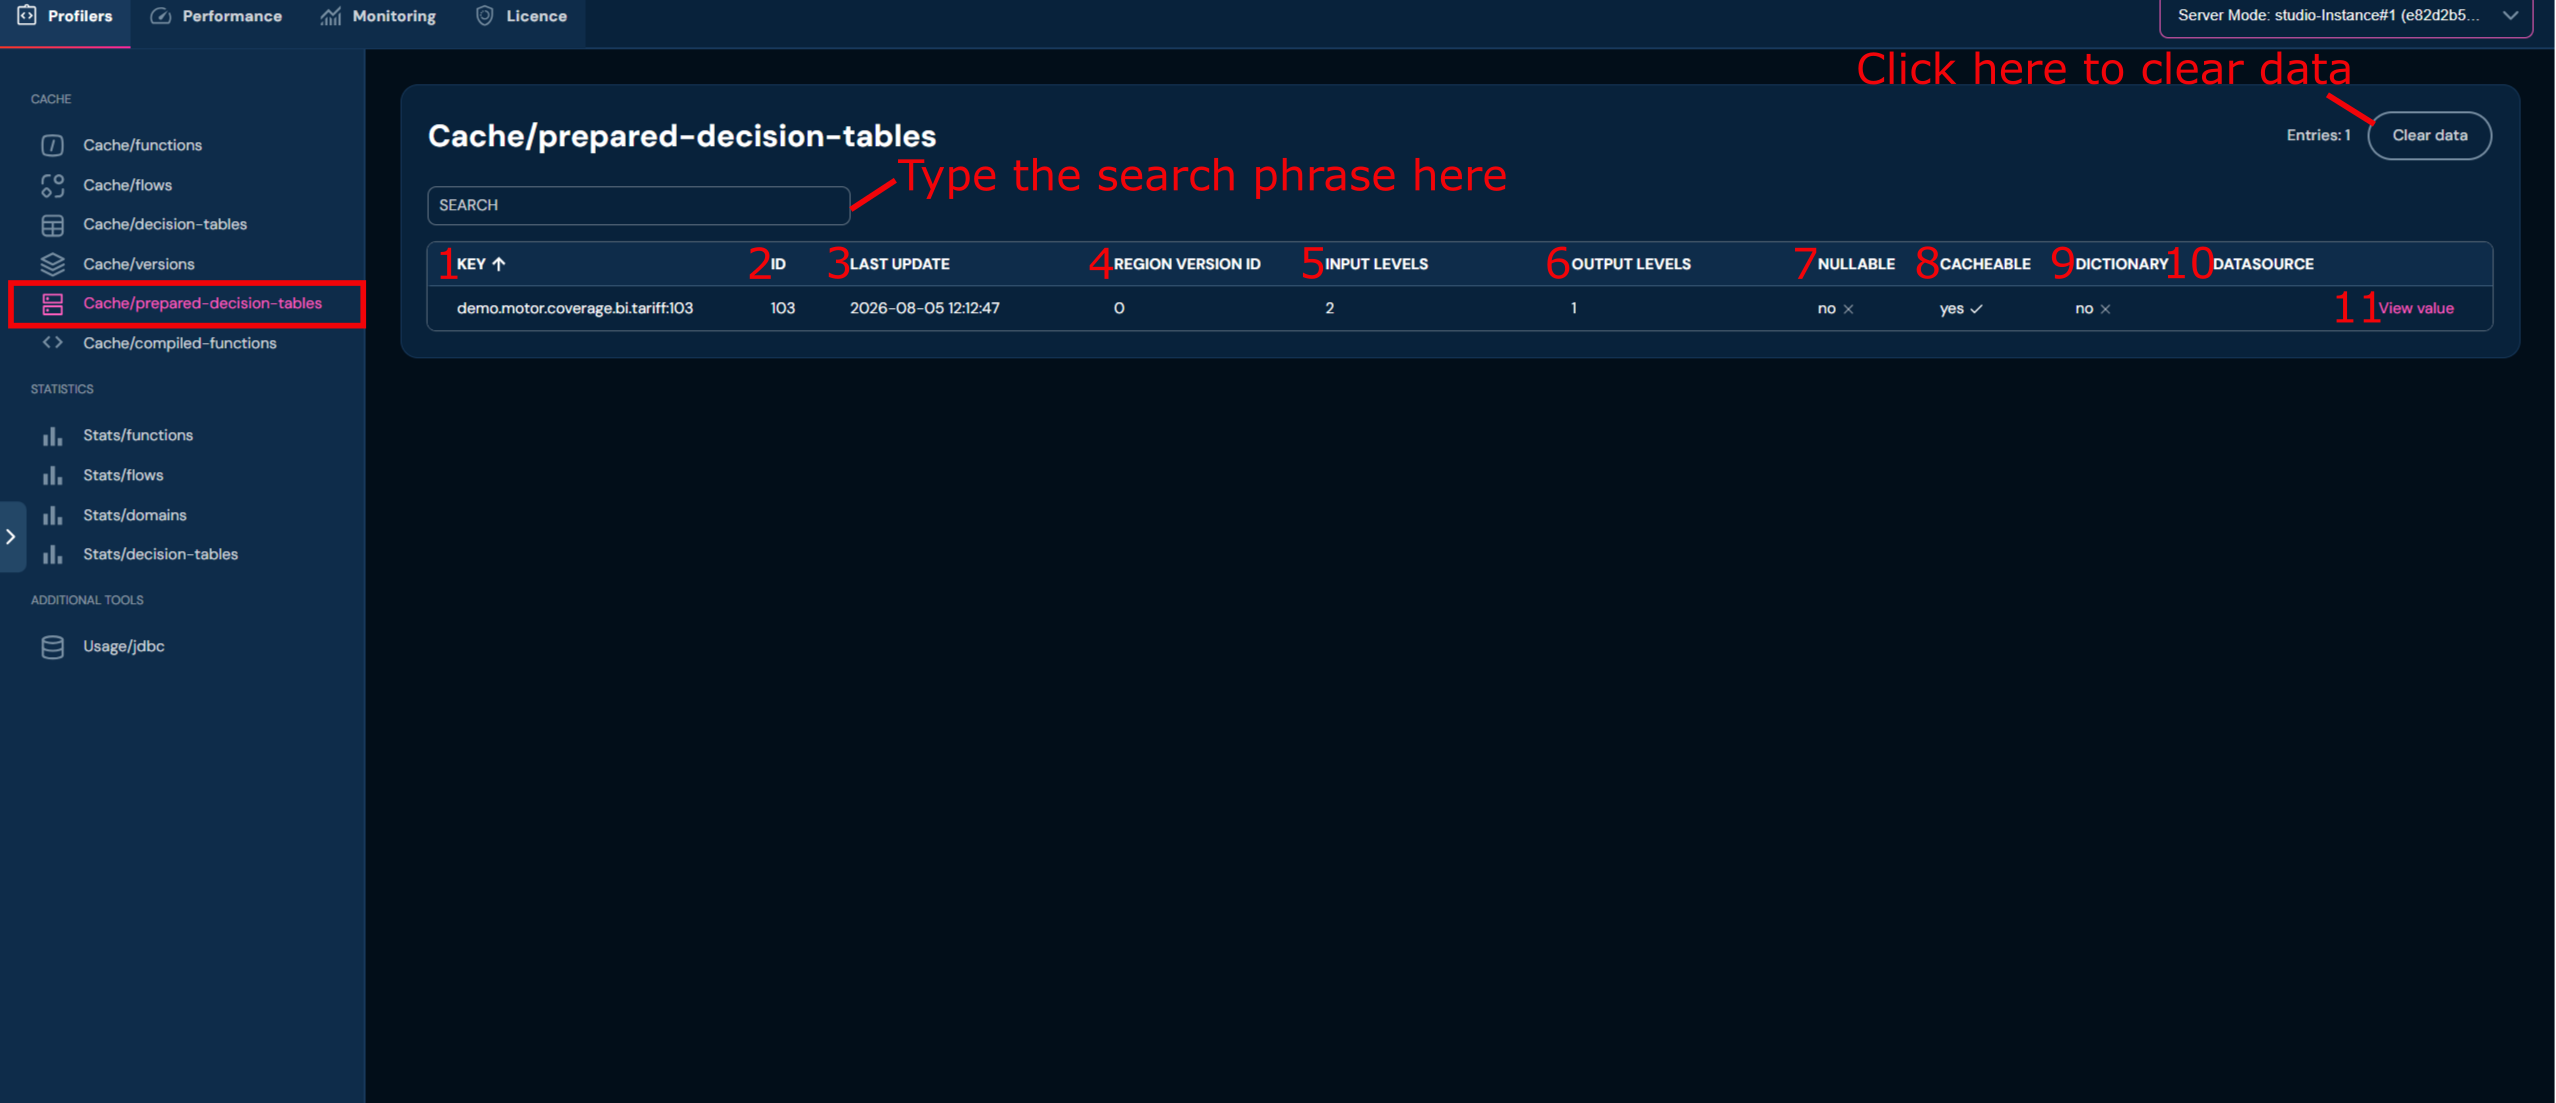
| No. | Column | Description |
|---|---|---|
| 1. | Key | Key identifying the prepared table. |
| 2. | ID | Table identifier. |
| 3. | Last Update | Date of last processing. |
| 4. | Region Version ID | Region version ID. |
| 5. | Input Levels | Table input levels (input parameter definitions). |
| 6. | Output Levels | Table output levels (output parameter definitions). |
| 7. | Nullable | Whether the table accepts null input values (yes / no). |
| 8. | Cacheable | Whether the prepared table result is cacheable (yes / no). |
| 9. | Dictionary | Whether the table is a dictionary table (yes / no). |
| 10. | Datasource | Data source associated with the prepared table. |
| 11. | View value | Link to view the full cache entry value. |
Use cases:
- Checking whether tables are correctly prepared for execution
- Diagnosing table performance issues (update dates)
- Verifying the input/output levels structure
Cache/compiled-functions#
Displays compiled functions — functions that have been compiled to executable form and are ready for immediate use.
Unlike Cache/functions (which shows function definitions — FunctionDto objects with metadata), Cache/compiled-functions shows the resulting compiled objects ready for direct execution by the engine. A function may exist in Cache/functions but not yet be compiled — it will appear here only after the first invocation.
The compiled objects are grouped by language cache — e.g. the Groovy Cache section lists all functions compiled by the Groovy engine.
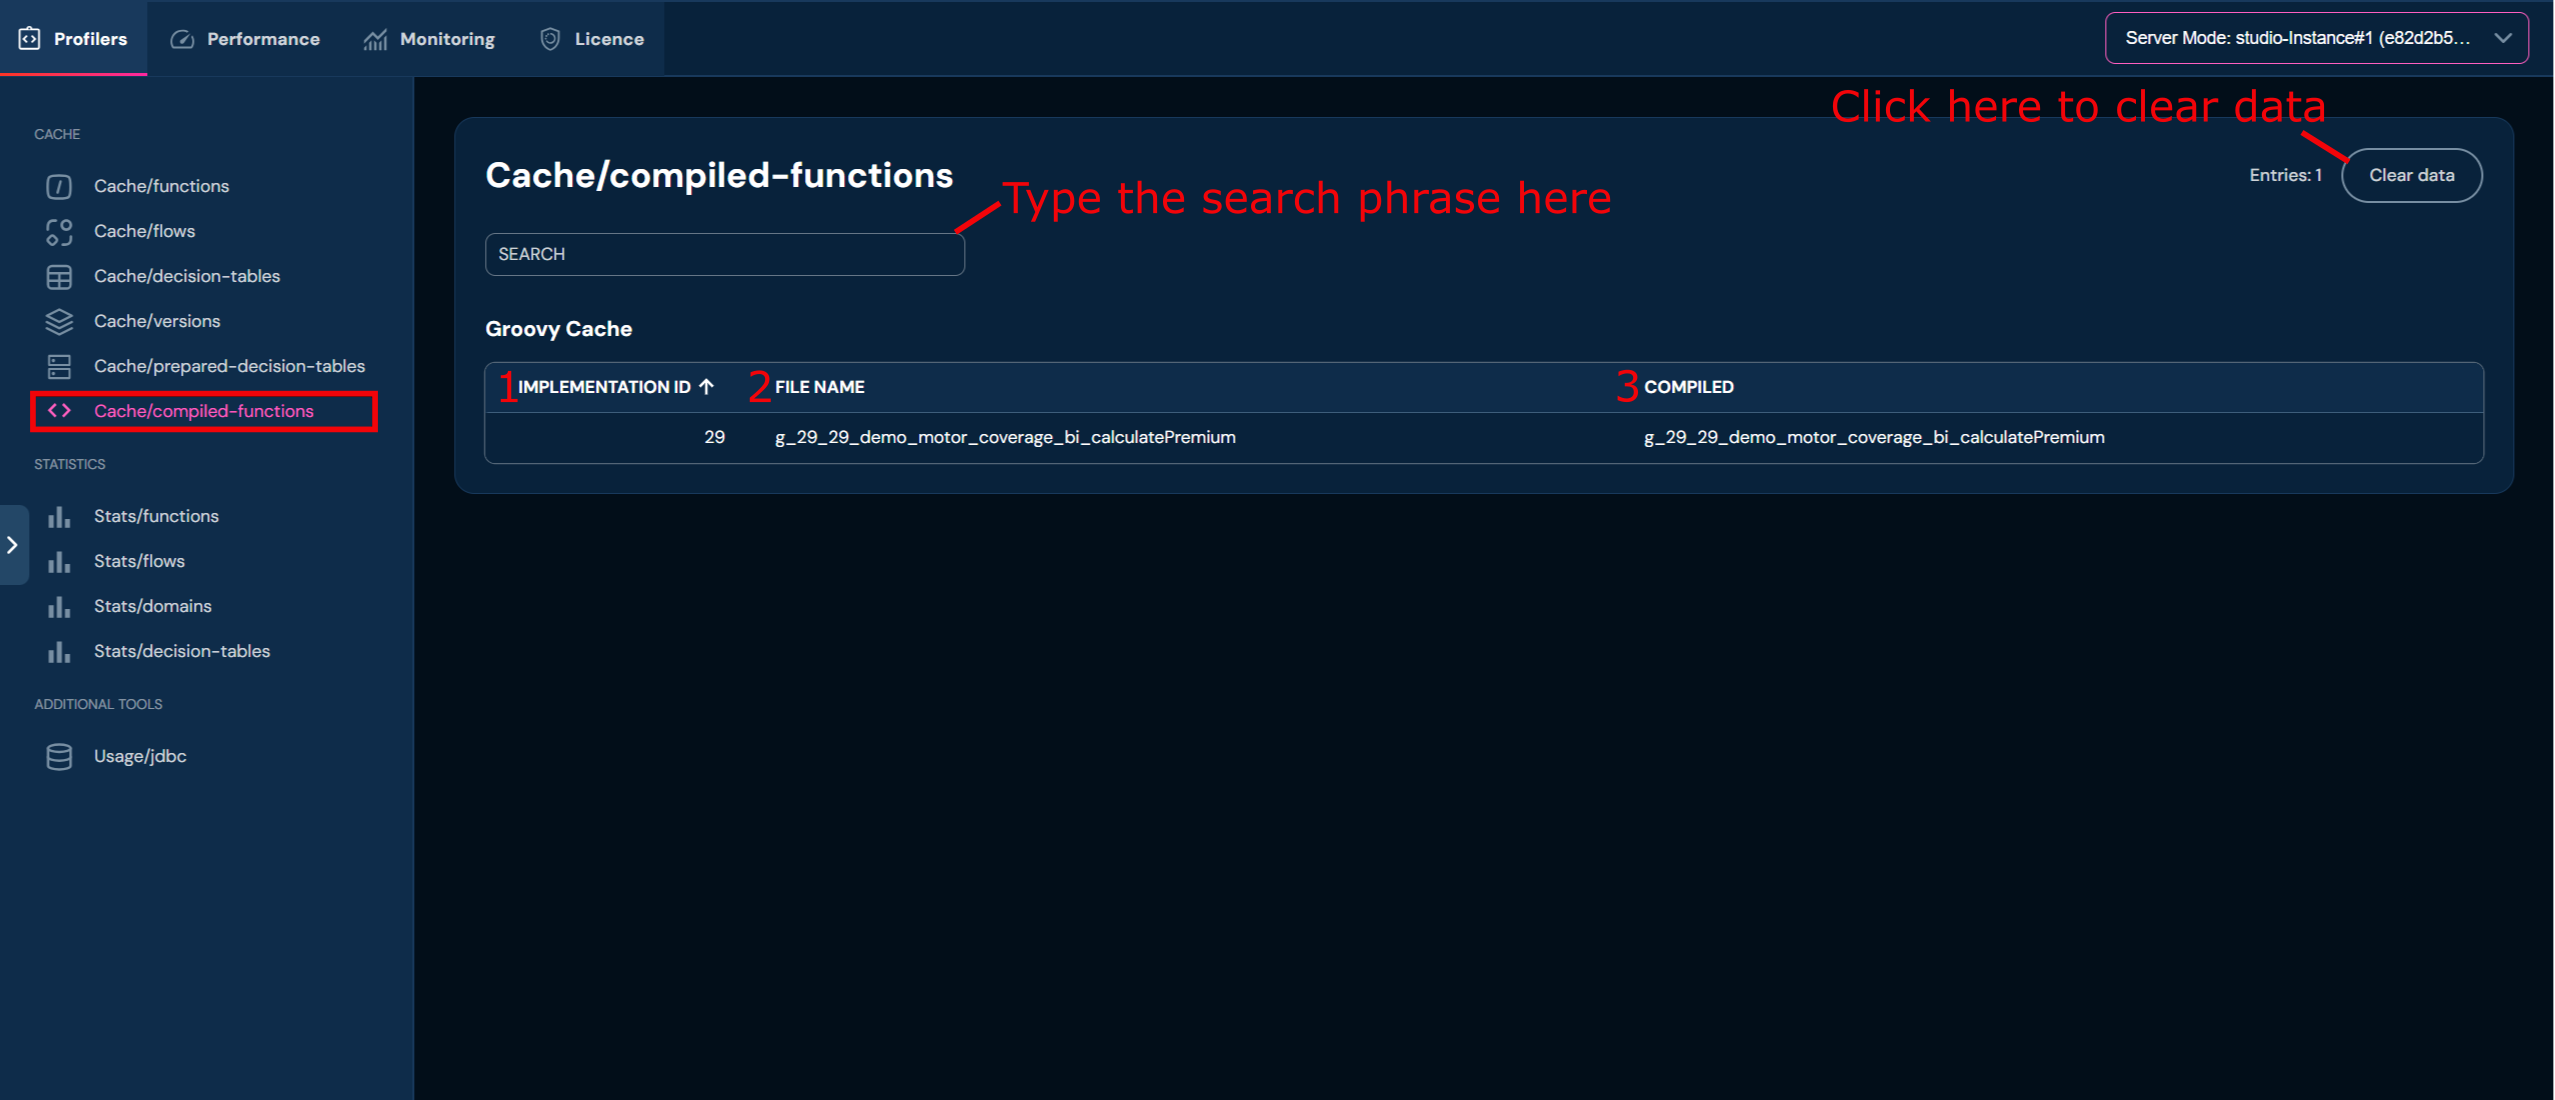
| No. | Column | Description |
|---|---|---|
| 1. | Implementation ID | Identifier of the compiled function implementation. |
| 2. | File Name | Name of the generated compiled file (e.g., g_29_29_demo_motor_coverage_bi_calculatePremium). |
| 3. | Compiled | Name of the compiled class/object ready for direct execution. |
Use cases:
- Verifying that functions are correctly compiled
- Identifying functions that have not yet been compiled (missing from cache)
- Diagnosing compilation errors — if a function is in Cache/functions but not in Cache/compiled-functions, it may indicate a compilation error
STATISTICS Section#
The STATISTICS section presents performance metrics for calls to individual elements of the Higson engine. It helps identify bottlenecks and optimize configuration. Each subpage in this section has a Search field and a Clear data button that allows clearing the collected statistics.
Statistics may be presented in two separate tables:
- Invoke Stats — timing metrics for the execution (invocation) of a given element at runtime.
- Load Stats — timing metrics for loading/compiling the element from its source into the cache.
Both tables share the same columns (Key, Max Time, Min Time, Average Time, Total Time, Count). A table is shown only when the corresponding statistics have been collected.
Stats/functions#
Statistics of function calls — how many times a given function was called and how long its execution took. This subpage presents both the Invoke Stats and Load Stats tables; each has the column structure shown below (analogous to Stats/domains).
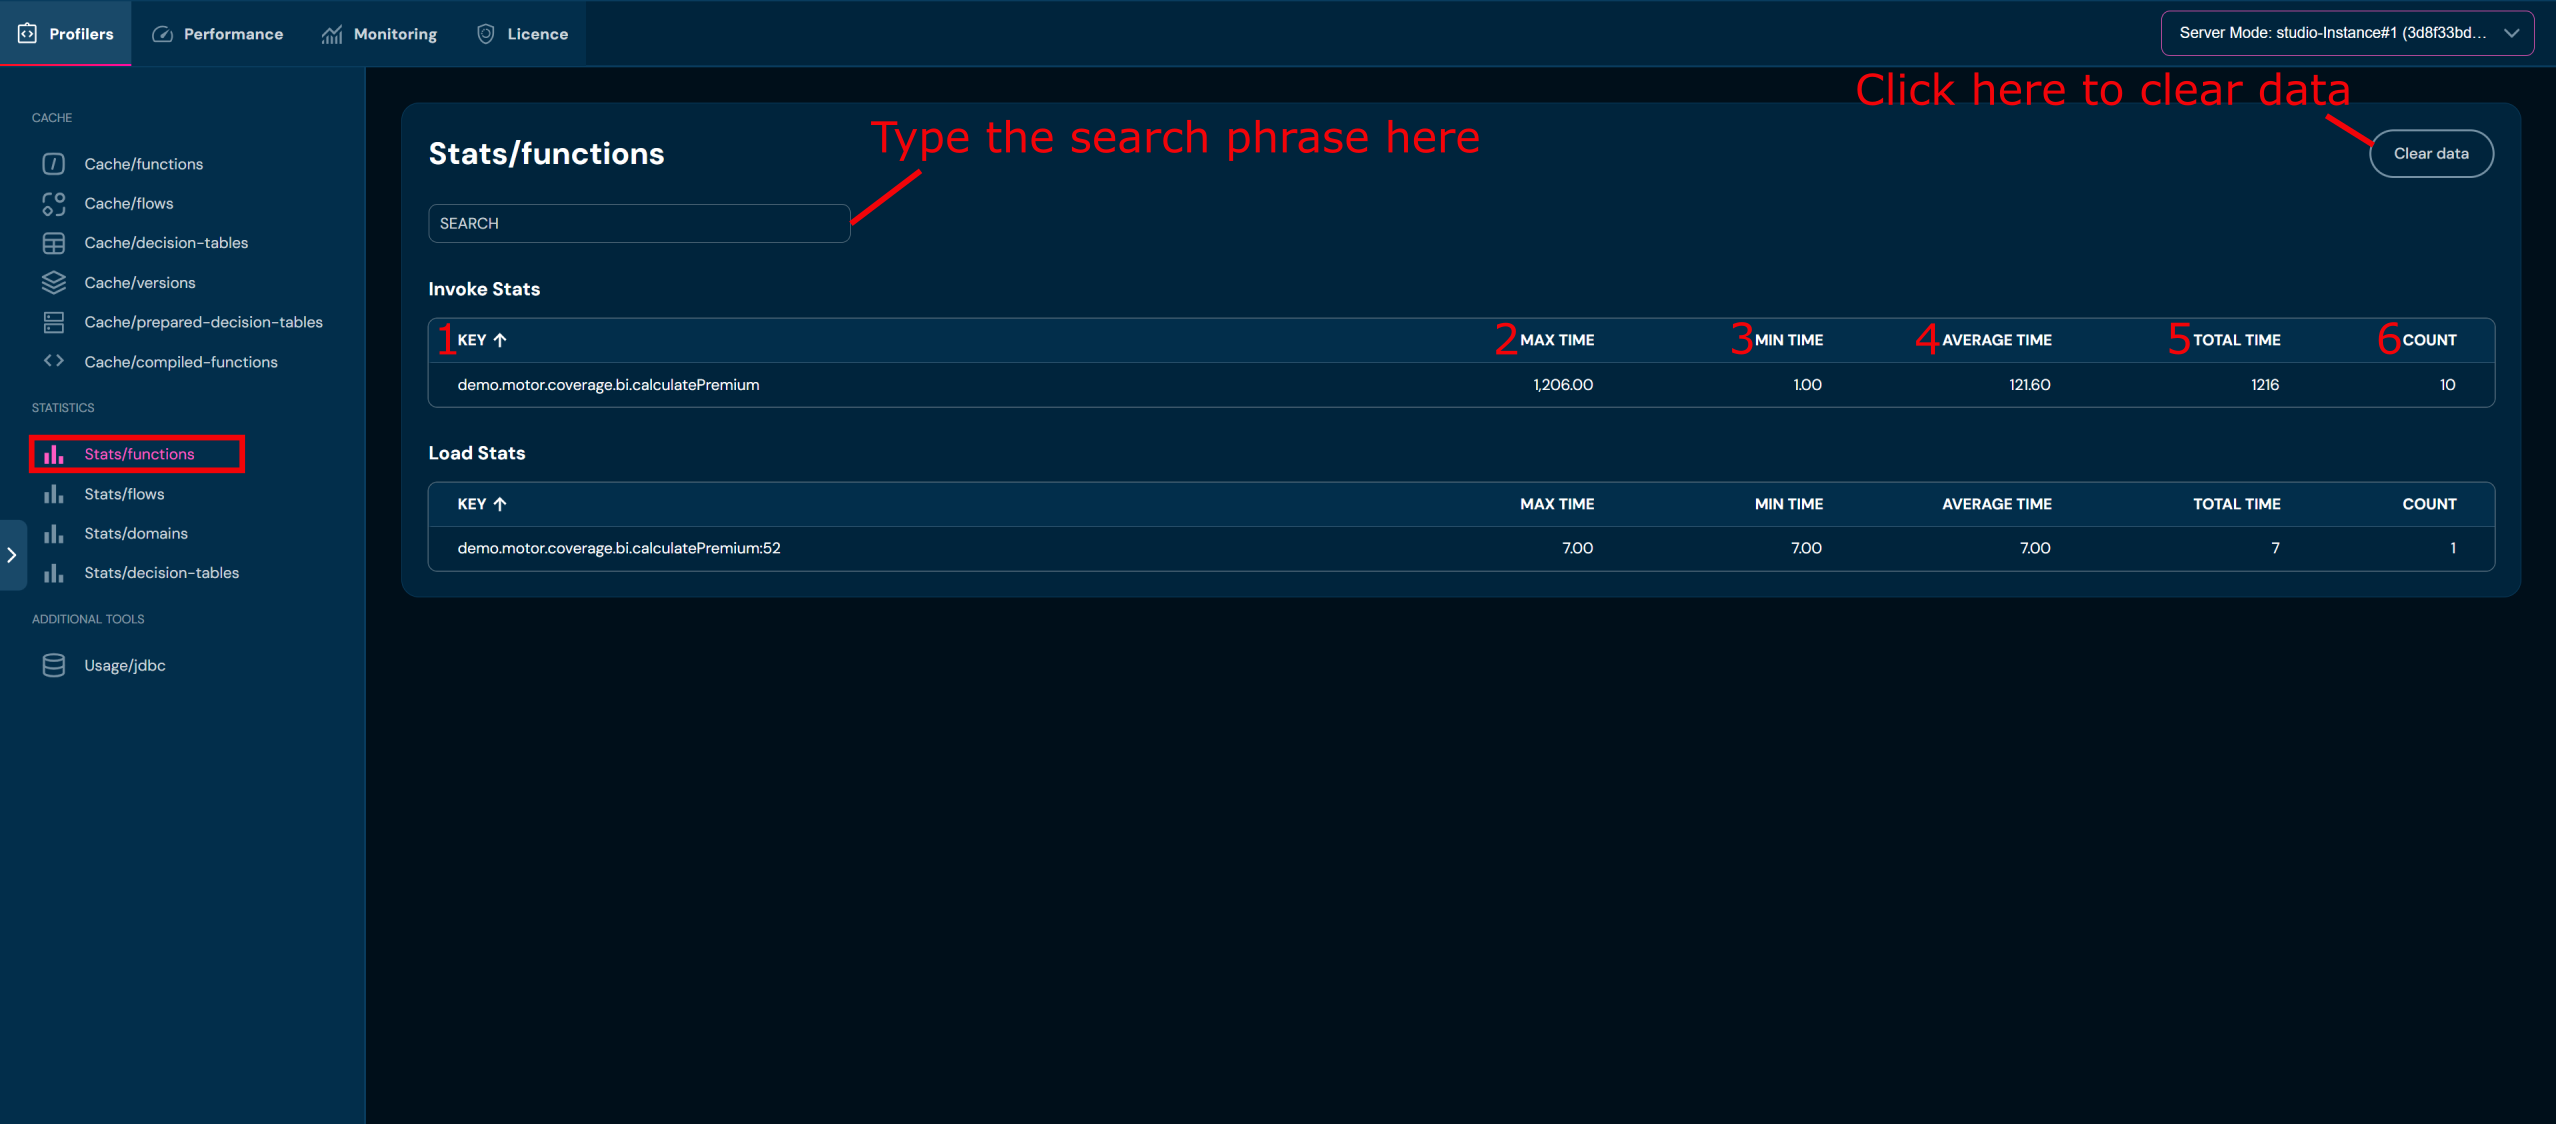
| No. | Column | Description |
|---|---|---|
| 1. | Key | Function name (code). |
| 2. | Max Time | Maximum execution time (ms). |
| 3. | Min Time | Minimum execution time (ms). |
| 4. | Average Time | Average execution time (ms). |
| 5. | Total Time | Total time of all calls (ms). |
| 6. | Count | Number of function calls. |
Use cases:
- Identifying the most frequently called functions (Count column)
- Detecting slow functions requiring optimization (Max Time column)
- Stability analysis — a large difference between Min Time and Max Time may indicate instability
Stats/flows#
Statistics of flow calls. The table structure is analogous to Stats/domains.
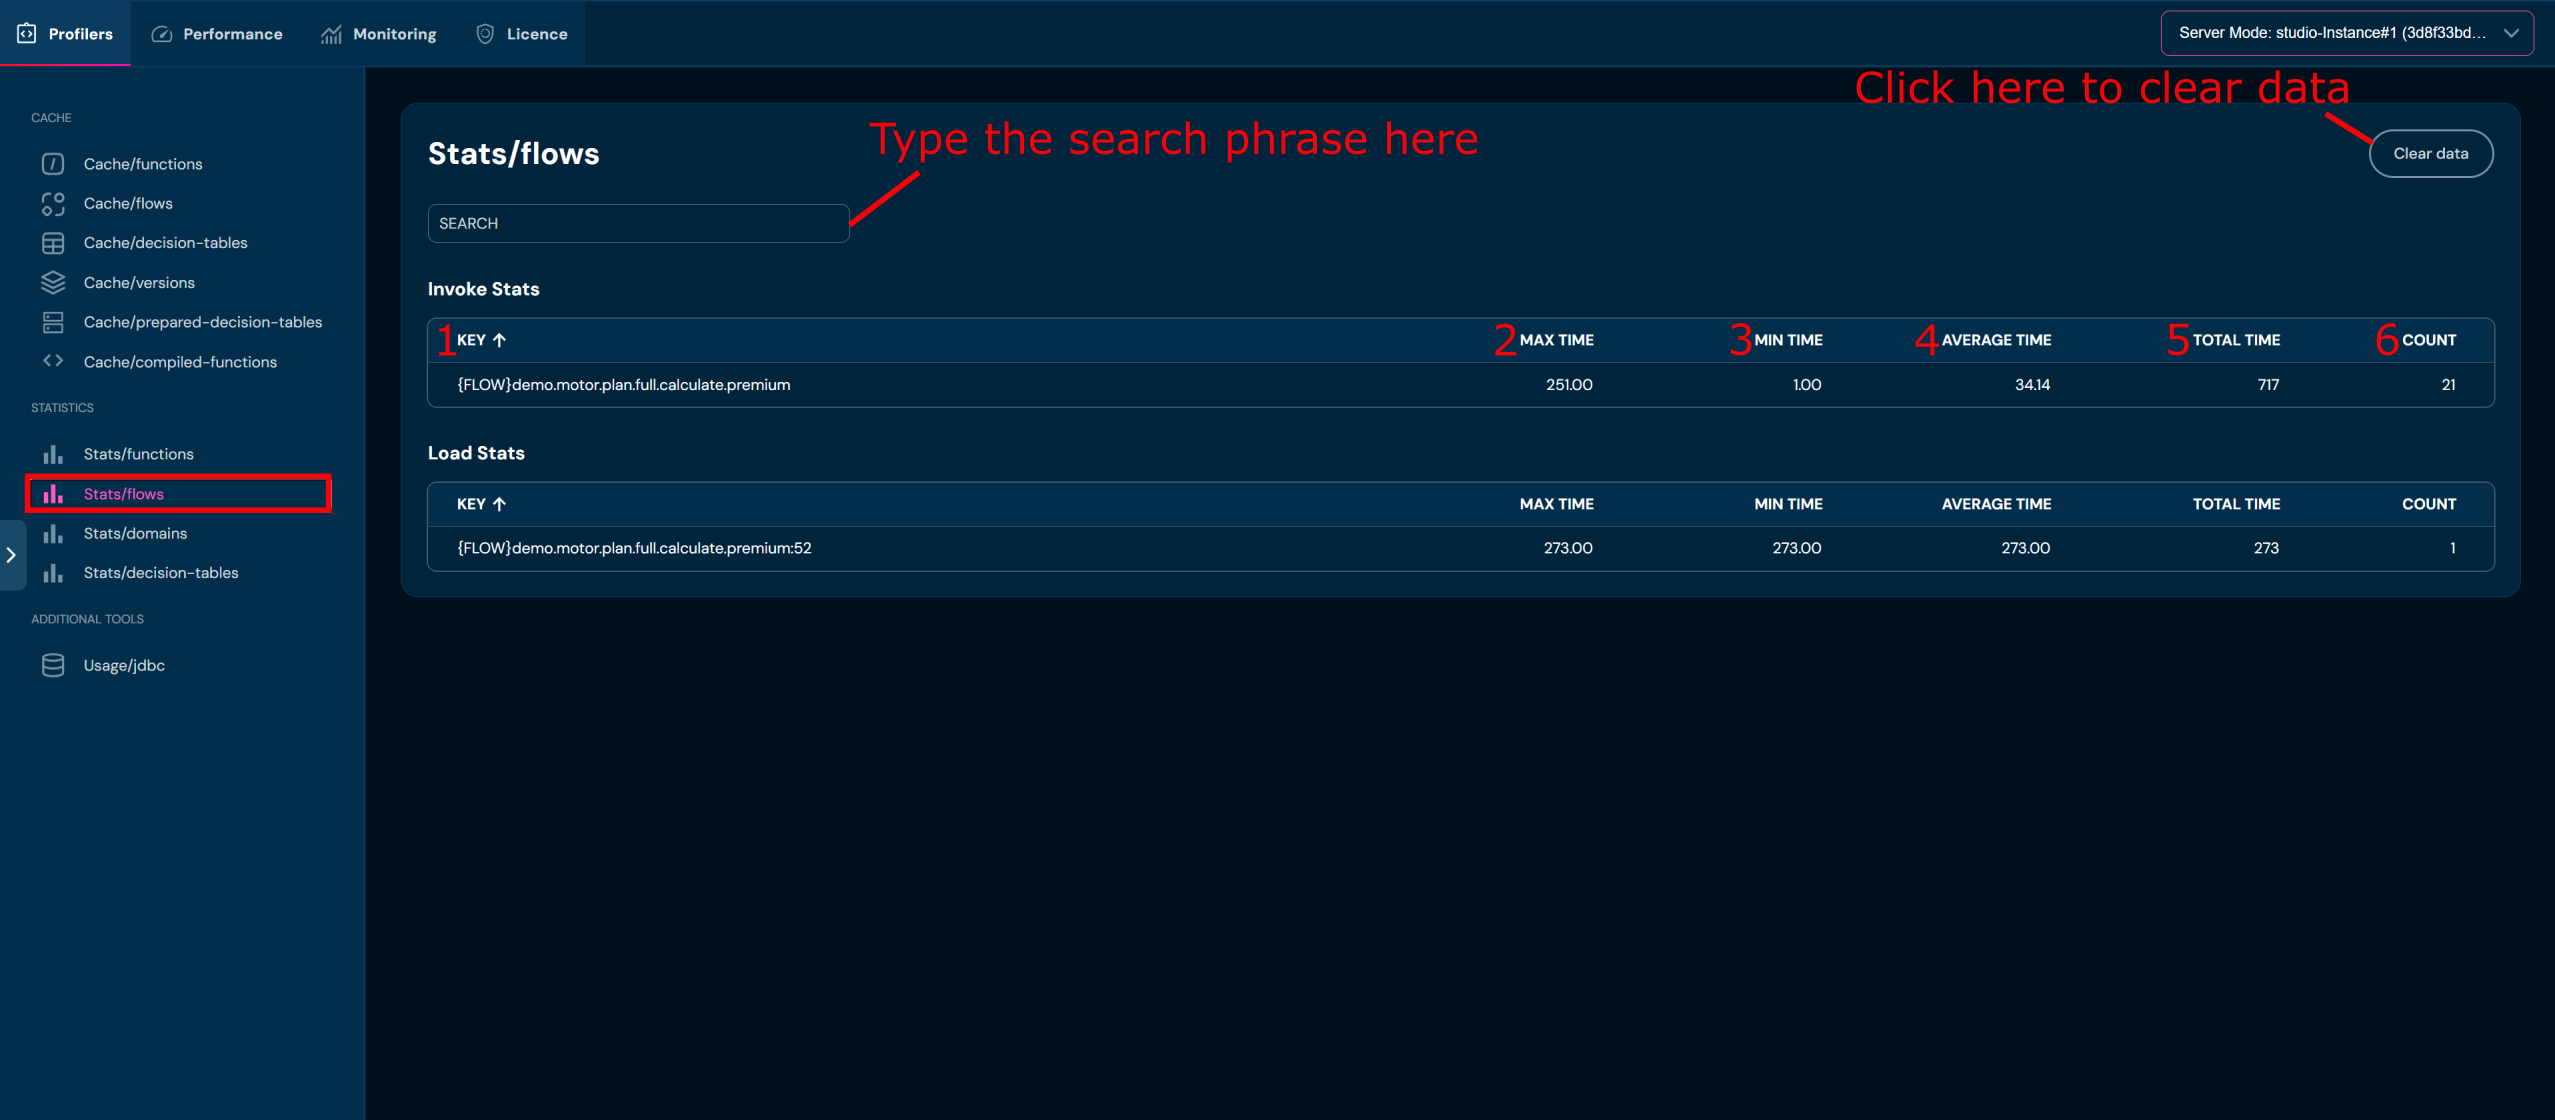
| No. | Column | Description |
|---|---|---|
| 1. | Key | Flow name (code). |
| 2. | Max Time | Maximum execution time (ms). |
| 3. | Min Time | Minimum execution time (ms). |
| 4. | Average Time | Average execution time (ms). |
| 5. | Total Time | Total time of all calls (ms). |
| 6. | Count | Number of flow calls. |
Use cases:
- Identifying the slowest and most frequently called flows
- Comparing performance across different flows
Stats/domains#
Statistics of operations on domain (business data structures) of the Higson engine. Presents the Invoke Stats section with time metrics.
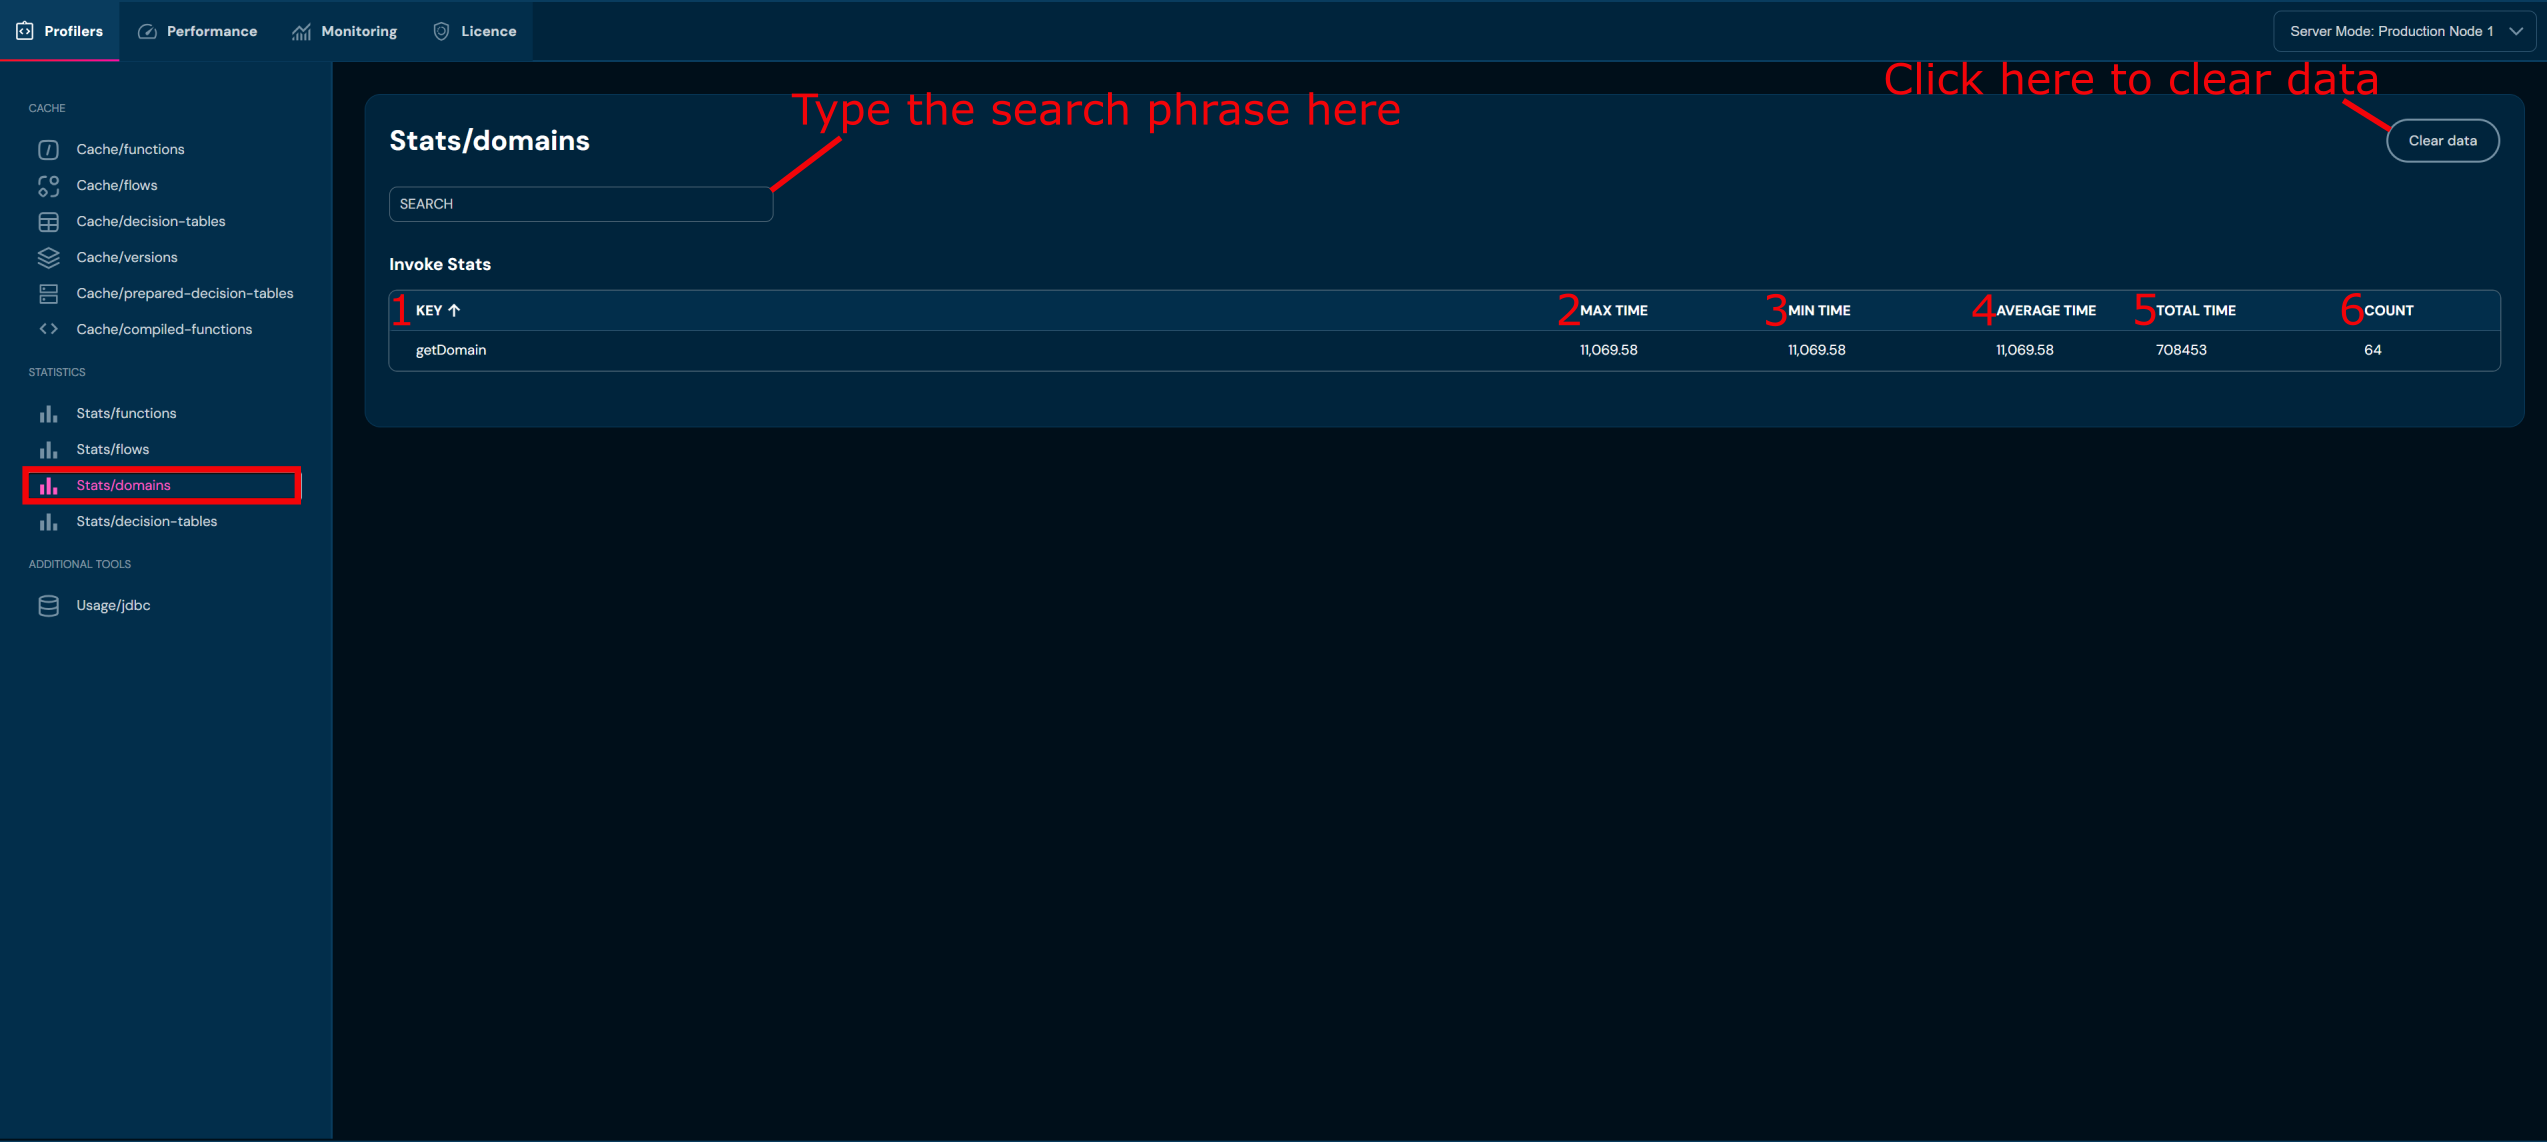
| No. | Column | Description |
|---|---|---|
| 1. | Key | Operation name (e.g., getDomain). |
| 2. | Max Time | Maximum operation execution time (ms). |
| 3. | Min Time | Minimum execution time (ms). |
| 4. | Average Time | Average execution time (ms). |
| 5. | Total Time | Total time of all calls (ms). |
| 6. | Count | Number of operation calls (e.g., 476). |
Use cases:
- Identifying domain operations with the longest execution time
- Monitoring performance trends
- Comparing min/max/avg to detect anomalies
- Load analysis — the Count column shows how many times the operation was called
Stats/decision-tables#
Statistics of decision table calls. This subpage presents both the Invoke Stats and Load Stats tables; each has the column structure shown below (analogous to Stats/domains).
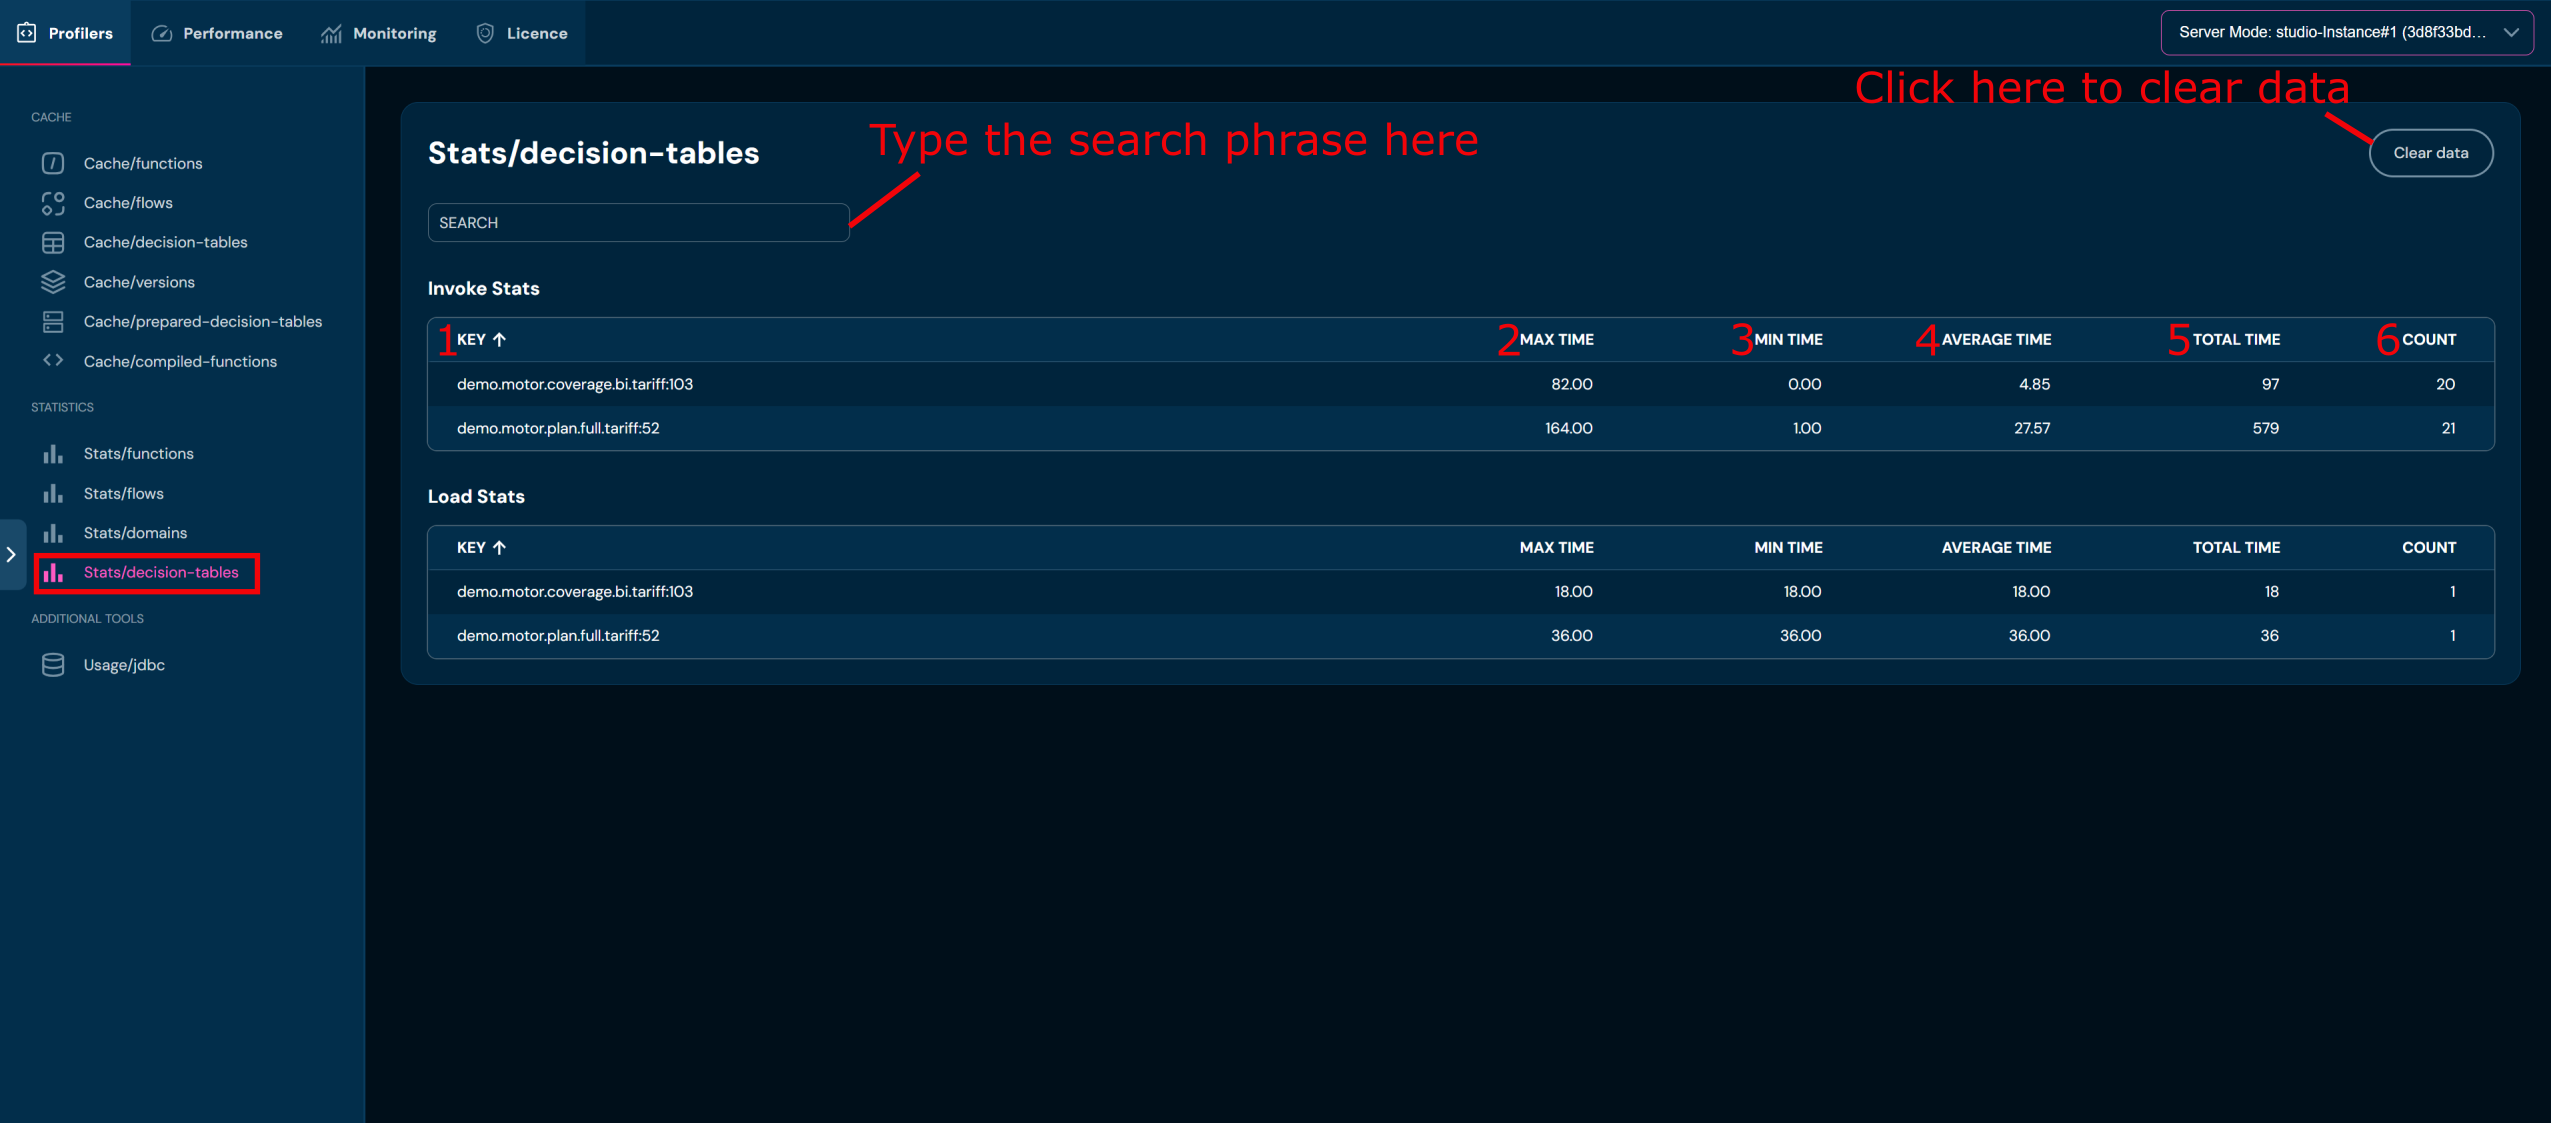
| No. | Column | Description |
|---|---|---|
| 1. | Key | Decision table name (code). |
| 2. | Max Time | Maximum execution time (ms). |
| 3. | Min Time | Minimum execution time (ms). |
| 4. | Average Time | Average execution time (ms). |
| 5. | Total Time | Total time of all calls (ms). |
| 6. | Count | Number of table calls. |
Use cases:
- Identifying the slowest decision tables
- Comparing performance of tables with different complexity (number of in/out parameters)
ADDITIONAL TOOLS Section#
Usage/jdbc#
Displays a list of SQL queries (JDBC) generated by the Higson engine during operation. This is a key tool for diagnosing database layer performance. It has a Clear data button to clear the collected data.
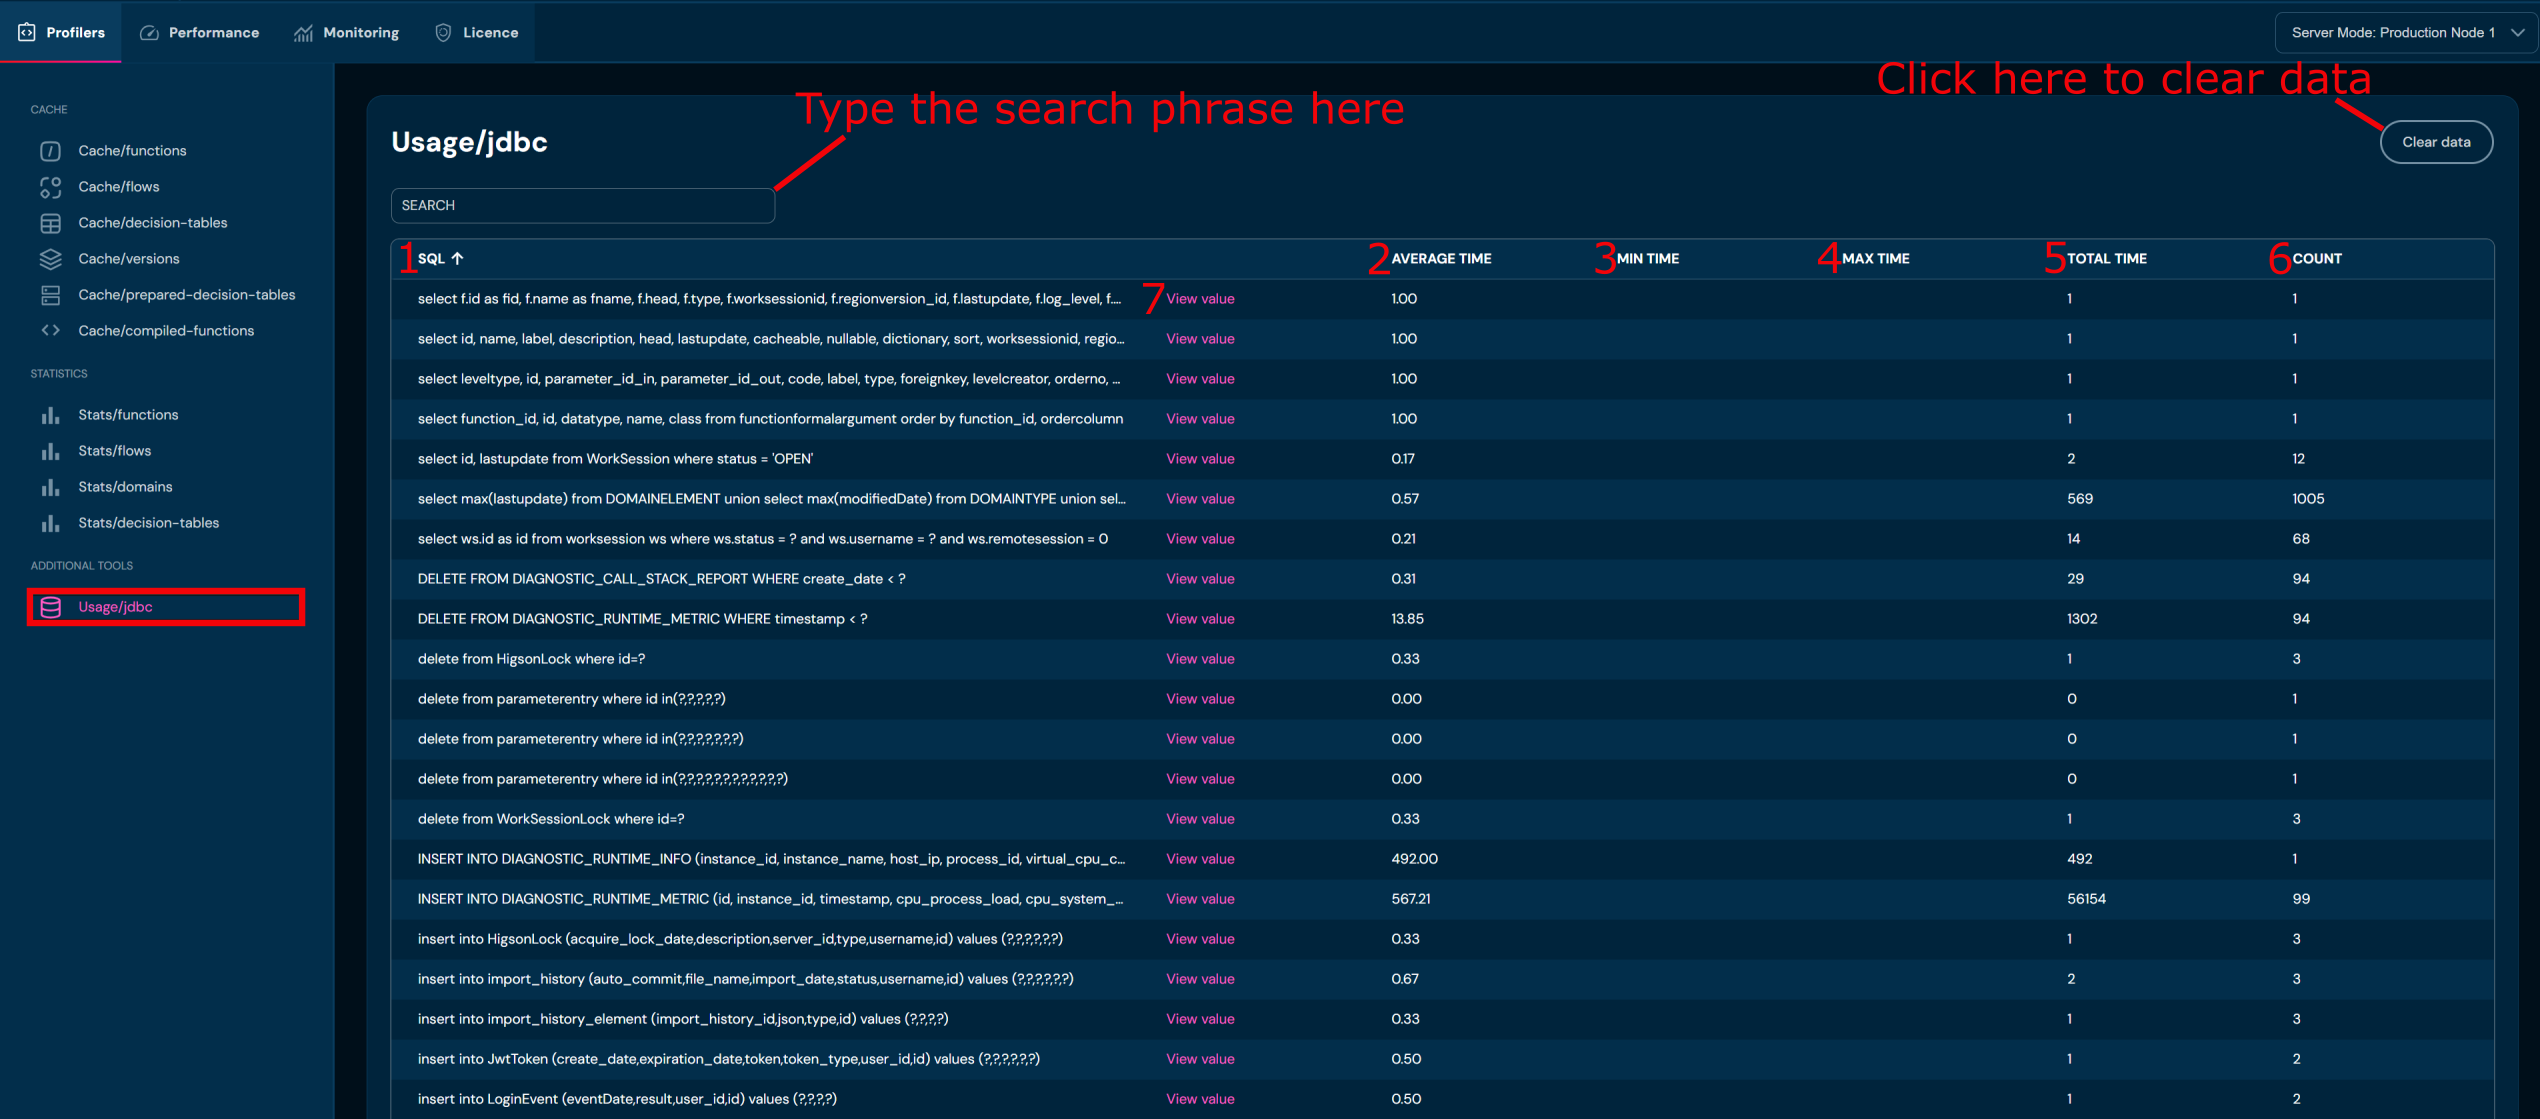
| No. | Column/Action name | Description |
|---|---|---|
| 1. | SQL | SQL query content (abbreviated, with the option to view the full text). |
| 2. | Average Time | Average query execution time (ms). |
| 3. | Min Time | Min time of all executions of the given query (ms). |
| 4. | Max Time | Max time of all executions of the given query (ms). |
| 5. | Total Time | Total time of all executions of the given query (ms). |
| 6. | Count | Number of executions of the given query. |
| 7. | View value | Link to view the full SQL query text along with statistics. |
Use cases:
- Identifying slow SQL queries (sorting by Average Time)
- Identifying the most frequently executed queries (sorting by Count)
- Analyzing which queries the engine generates during various operations
- Optimizing the database layer (missing indexes, overly broad selections)
- Diagnosing database performance issues
Performance Tab#
The Performance tab records a detailed history of business rule executions in the system. Every function, decision table, flow, or domain operation call is logged with an exact timestamp and duration.
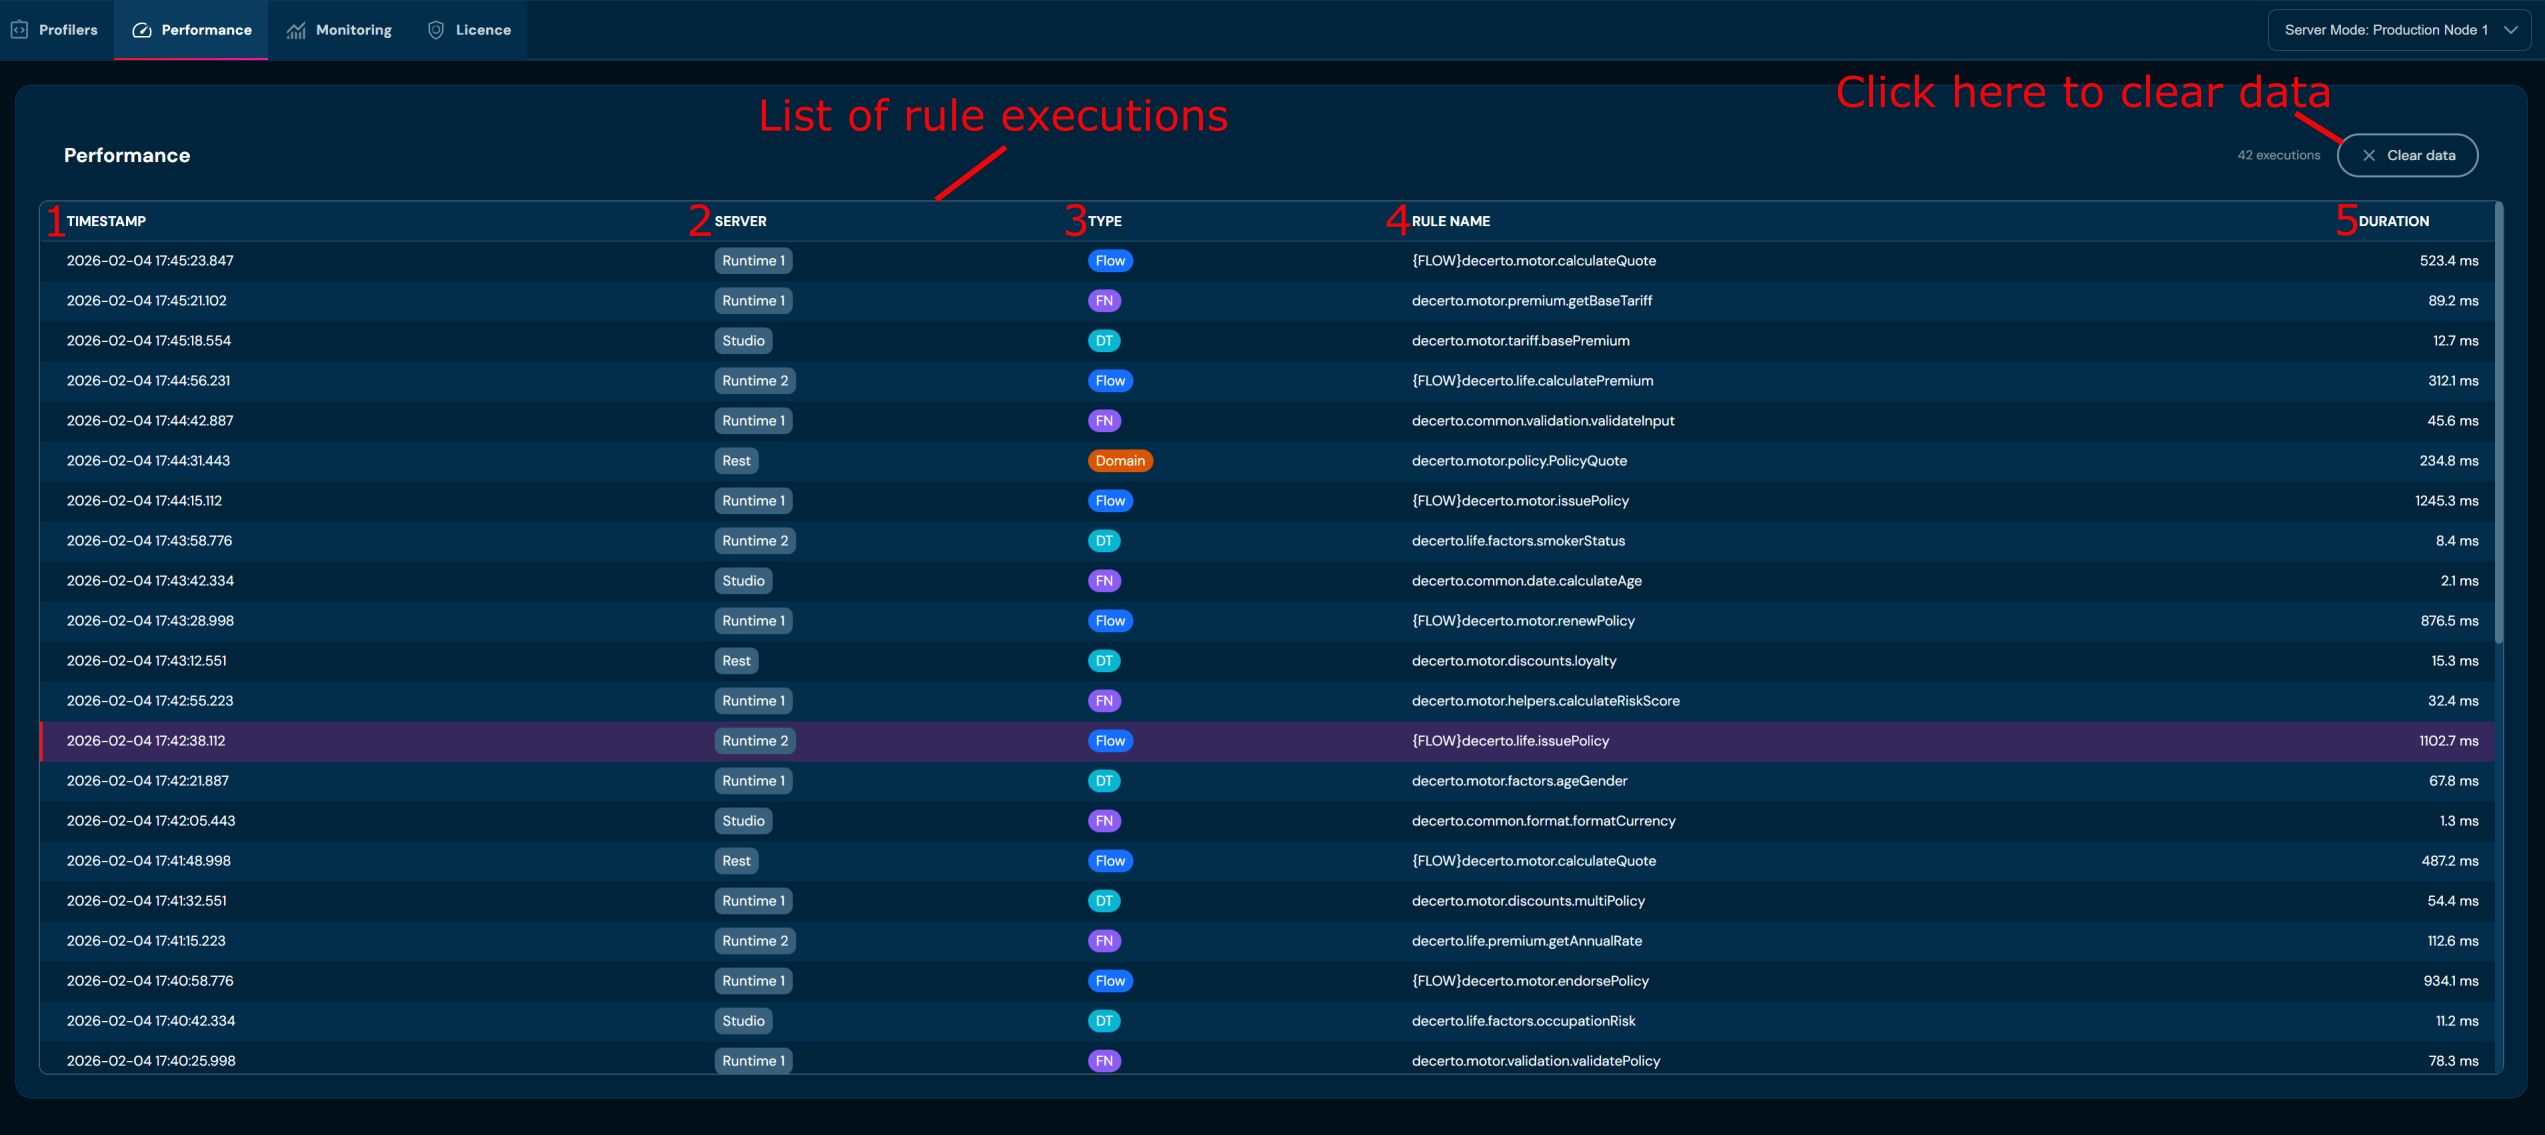
| No. | Column name | Description |
|---|---|---|
| 1. | Timestamp | Exact date and time of execution (with milliseconds), e.g., 2026-02-04 17:45:23.847. |
| 2. | Server | Server where the operation was executed. |
| 3. | Type | Business rule type — indicated by a colored badge: Flow (blue) — business flows;FN (purple) — functions ;DT (teal) — decision tables;Domain (orange) — domain operations. |
| 4. | Rule Name | Full name of the called rule, e.g., decerto.motor.policy.PolicyQuote. |
| 5. | Duration | Execution duration in milliseconds, e.g., 523.4 ms. |
Execution Details#
Clicking a row on the list opens the execution profile of that single call — a detailed breakdown of every component involved in the execution. A Back to list button returns to the history table. The header repeats the key context of the selected execution: the rule name, the timestamp, the server, and the total duration (e.g., 87.261 ms).
The profile is available in three views, switched with the tabs at the top:
- Call Tree — a hierarchical, expandable tree that mirrors the actual call order. Each node can be expanded or collapsed to reveal the calls it made (a flow calling a decision table, which in turn calls functions). The rightmost column shows each node’s share of the total execution time (%).
- Flame Graph — a stacked visualization of the same call stack, where the width of each bar is proportional to the time spent. Bars are colored by component type (see the legend). Clicking a frame zooms into that branch; the Reset button restores the full view.
- Method List — a flat, aggregated list of all components involved, regardless of their position in the tree. Its Calls column shows how many times each component was invoked, which helps identify the most expensive or most frequently called element.
Each component is marked with a colored type badge: Flow (blue), FN — Function (purple), DT — Decision Table (teal), and Domain (orange).
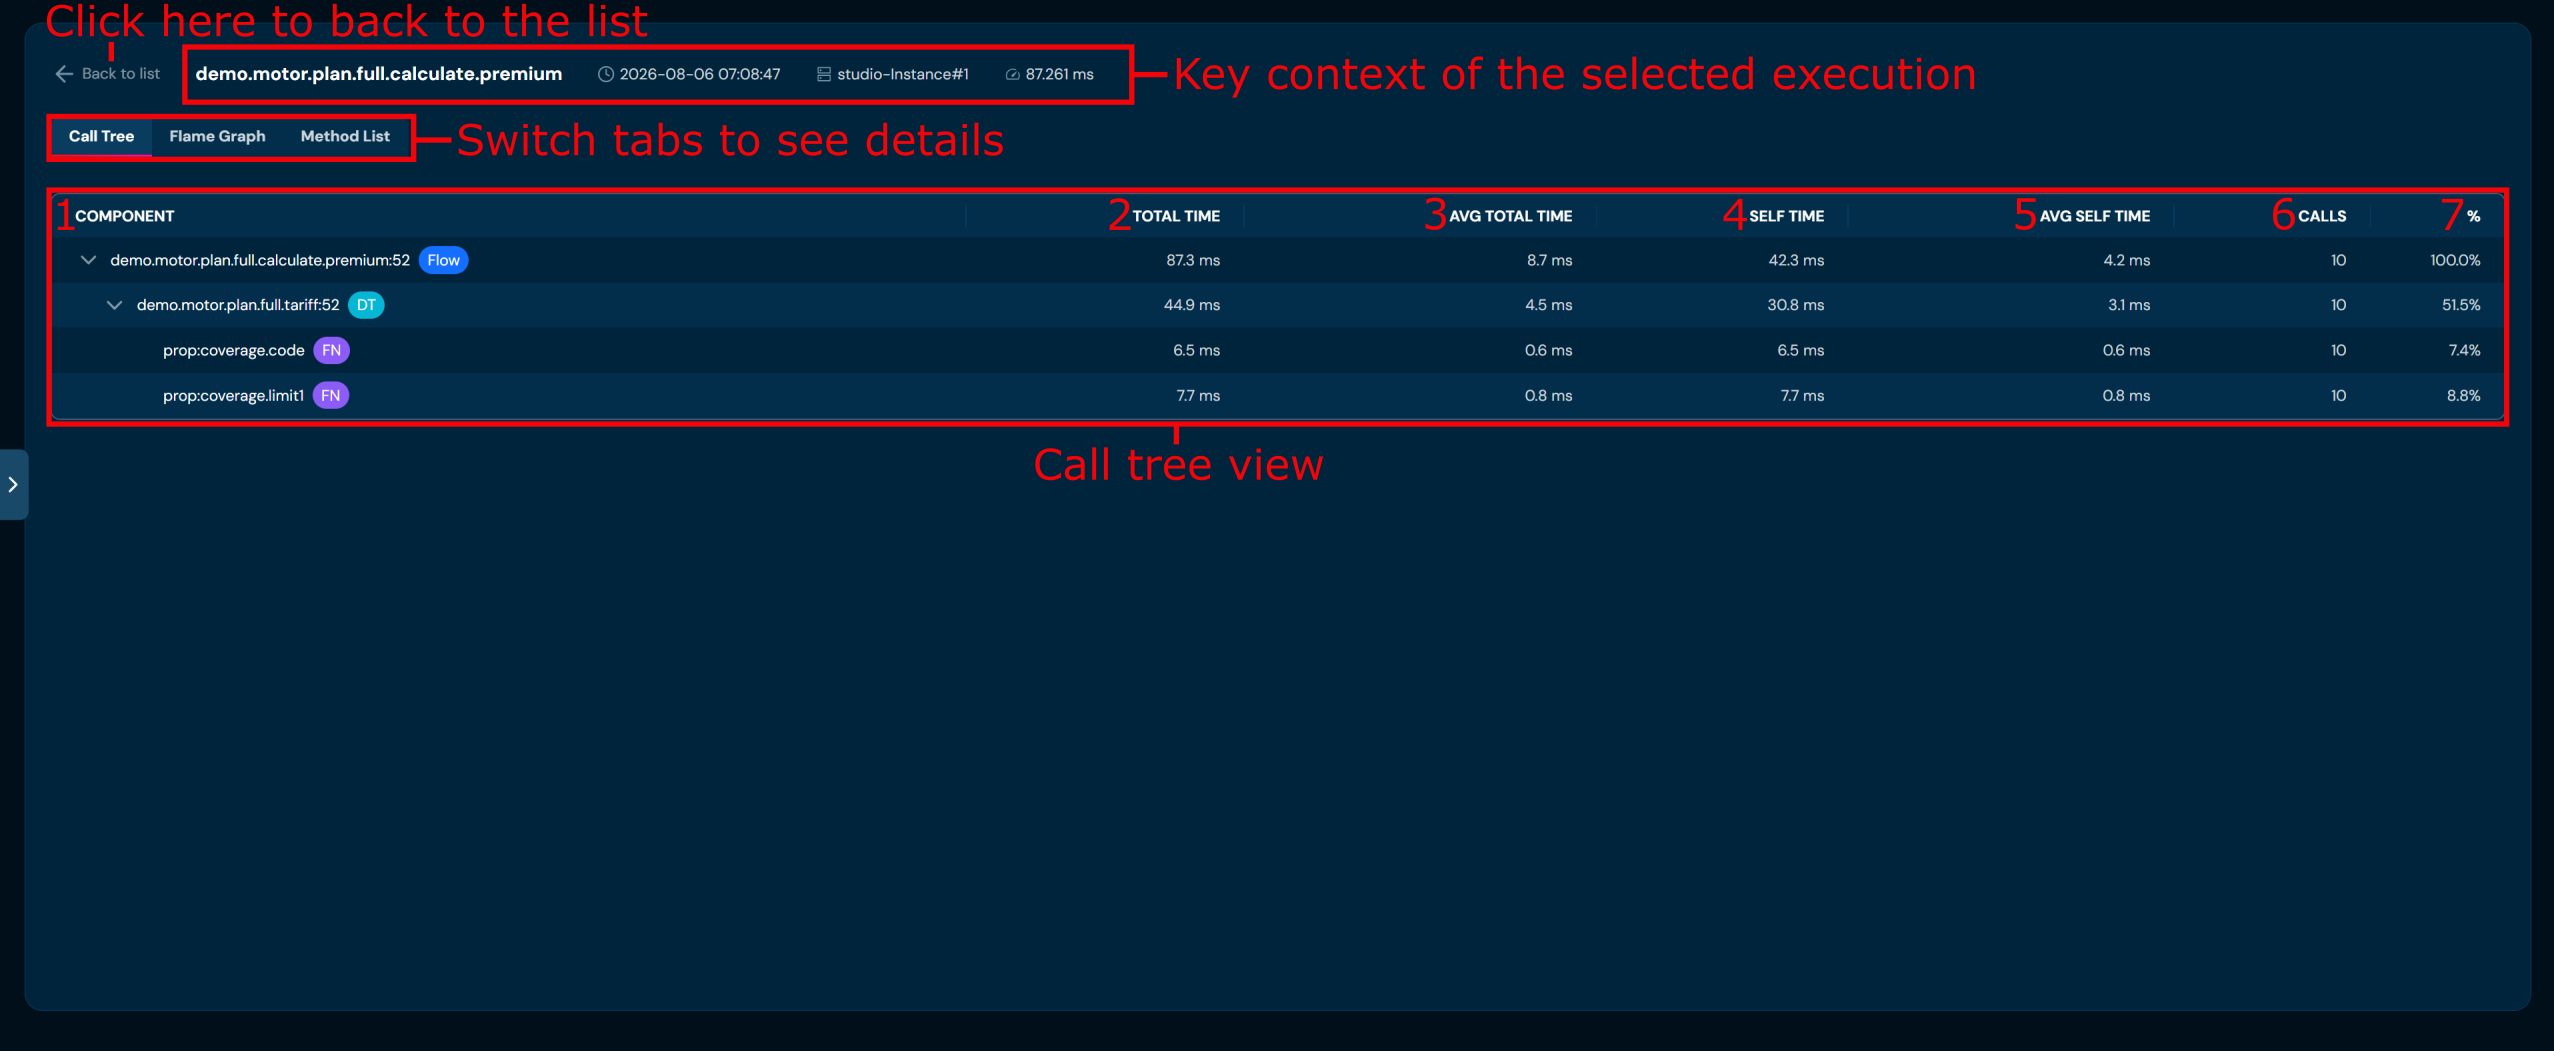
All three views share the same time metrics:
| No. | Column | Description |
|---|---|---|
| 1. | Component | Name of the executed element (flow, decision table, function, or domain operation), with a version suffix (e.g., :52) and a type badge. |
| 2. | Type | Component type — Flow, FN (Function), DT (Decision Table), or Domain. |
| 3. | Total Time | Total time spent in the component, including all nested calls. |
| 4. | Avg Total Time | Average total time per single call. |
| 5. | Self Time | Time spent in the component itself, excluding nested calls. |
| 6. | Avg Self Time | Average self time per single call. |
| 7. | Calls / % | Number of invocations of the component (Method List), or its share of the total execution time (Call Tree). |
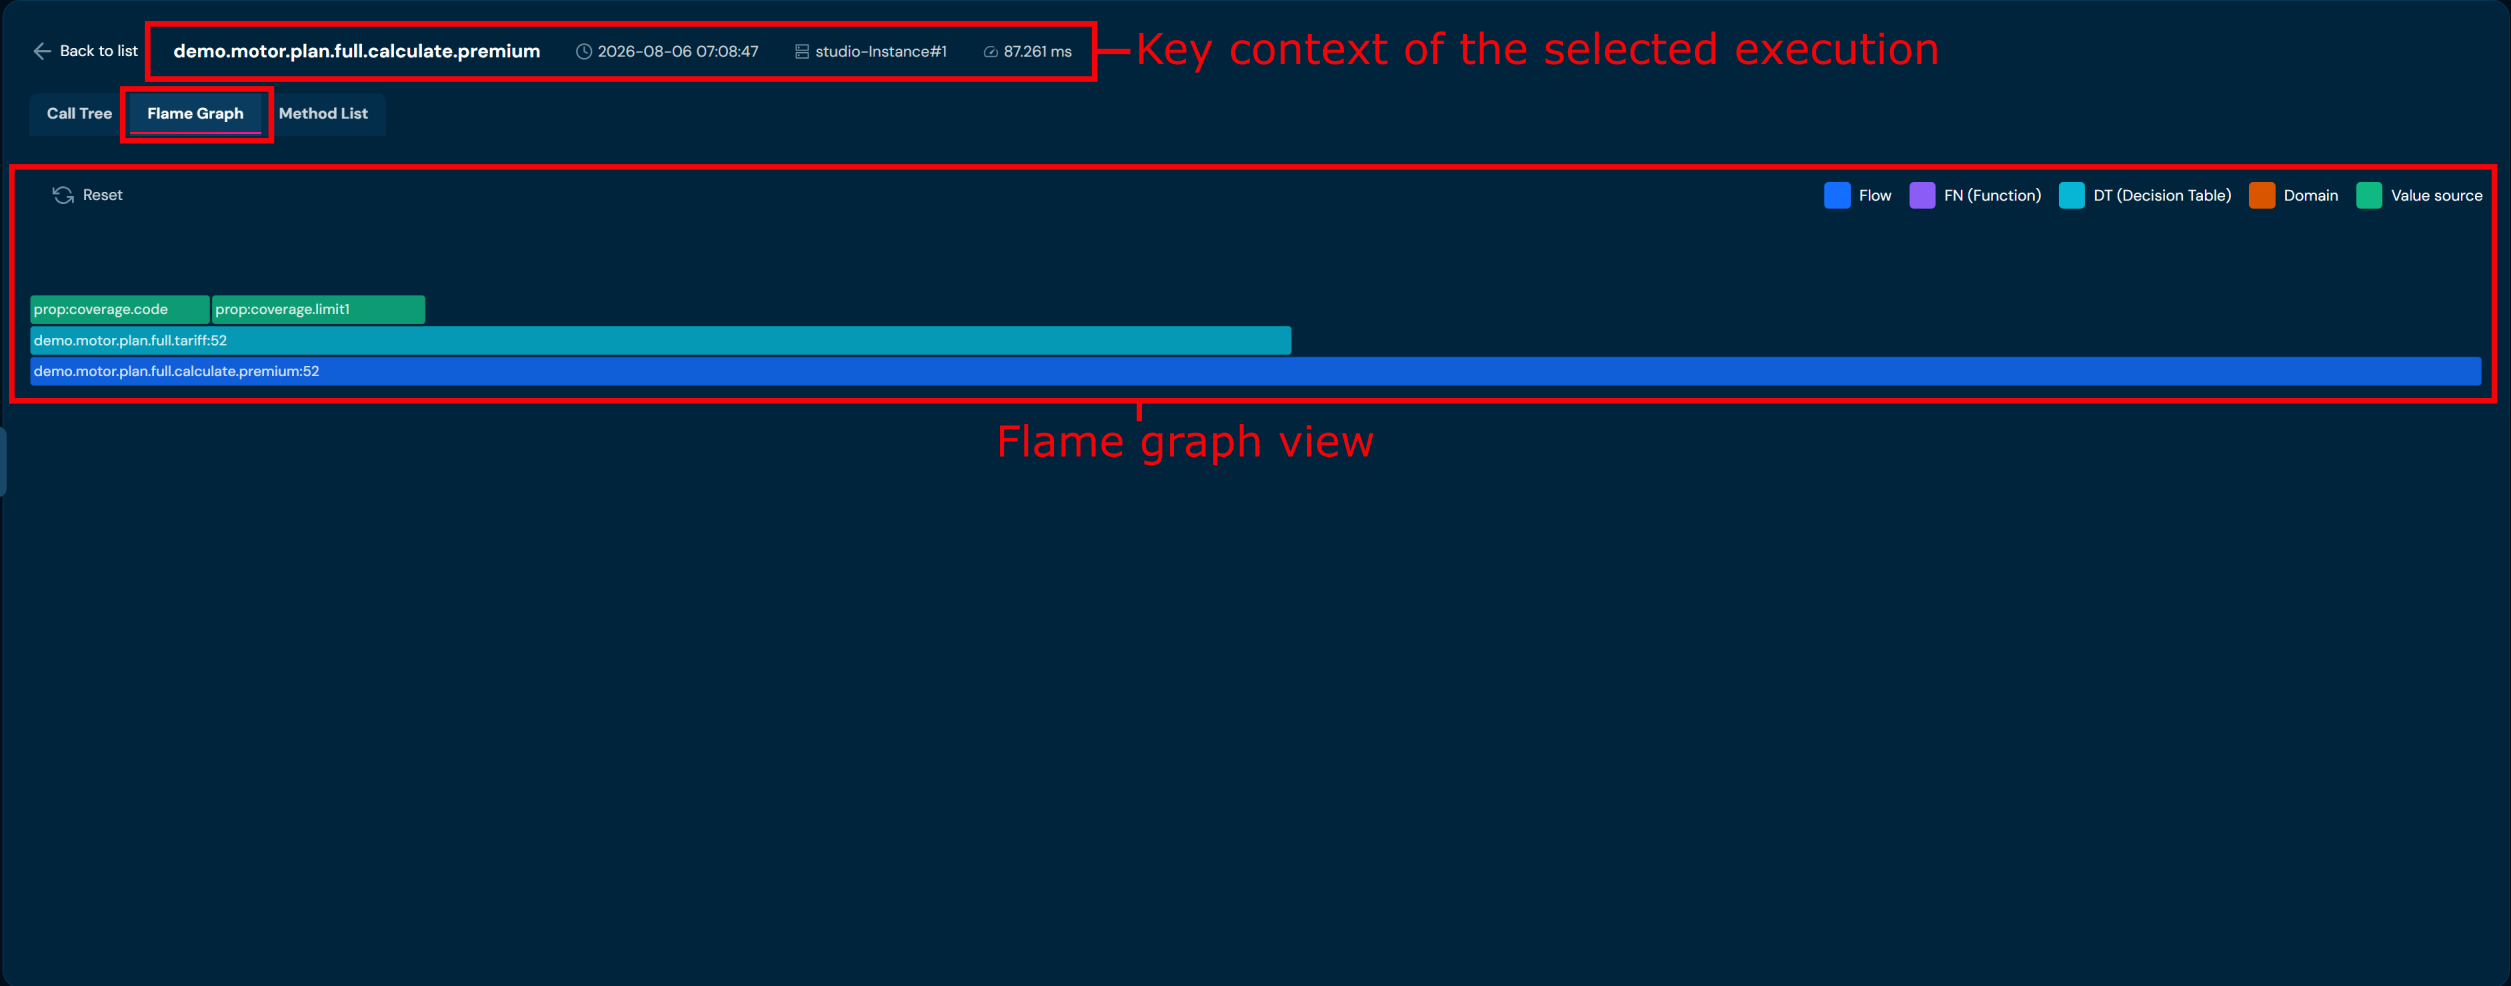
The flame graph presents the whole execution as a stack of frames:
- Each frame represents a single component call (flow, decision table, function, or domain operation).
- The vertical axis represents the call depth — the bottom frame is the entry point (the executed rule), and every frame above it is a call made by the frame directly below.
- The width of each frame is proportional to the time it took relative to the whole execution — the wider the frame, the larger its share of the total time.
- The color encodes the component type, following the legend: Flow (blue), FN — Function (purple), DT — Decision Table (teal), Domain (orange).
- Hovering over a frame shows a tooltip with its name, its share of the total time, and the absolute time — e.g.,
demo.motor.plan.full.tariff:52 (51.5%, 44.9 ms). - Clicking a frame zooms into that branch so it fills the available width; the Reset button restores the full view.
Advantages of the flame graph:
- Bottlenecks are visible at a glance — the widest frames are where most of the time is spent, with no need to read individual numbers.
- The full call hierarchy and its depth are shown in a single picture, making it easy to see how deeply rules are nested and which calls trigger which.
- Color-coding immediately reveals which type of component (flow, decision table, function, or domain) dominates the execution.
- Zooming lets you focus on a single branch of a large, complex execution.
- It complements the Call Tree (exact numbers) and Method List (aggregated totals) with a fast visual overview of the same data.
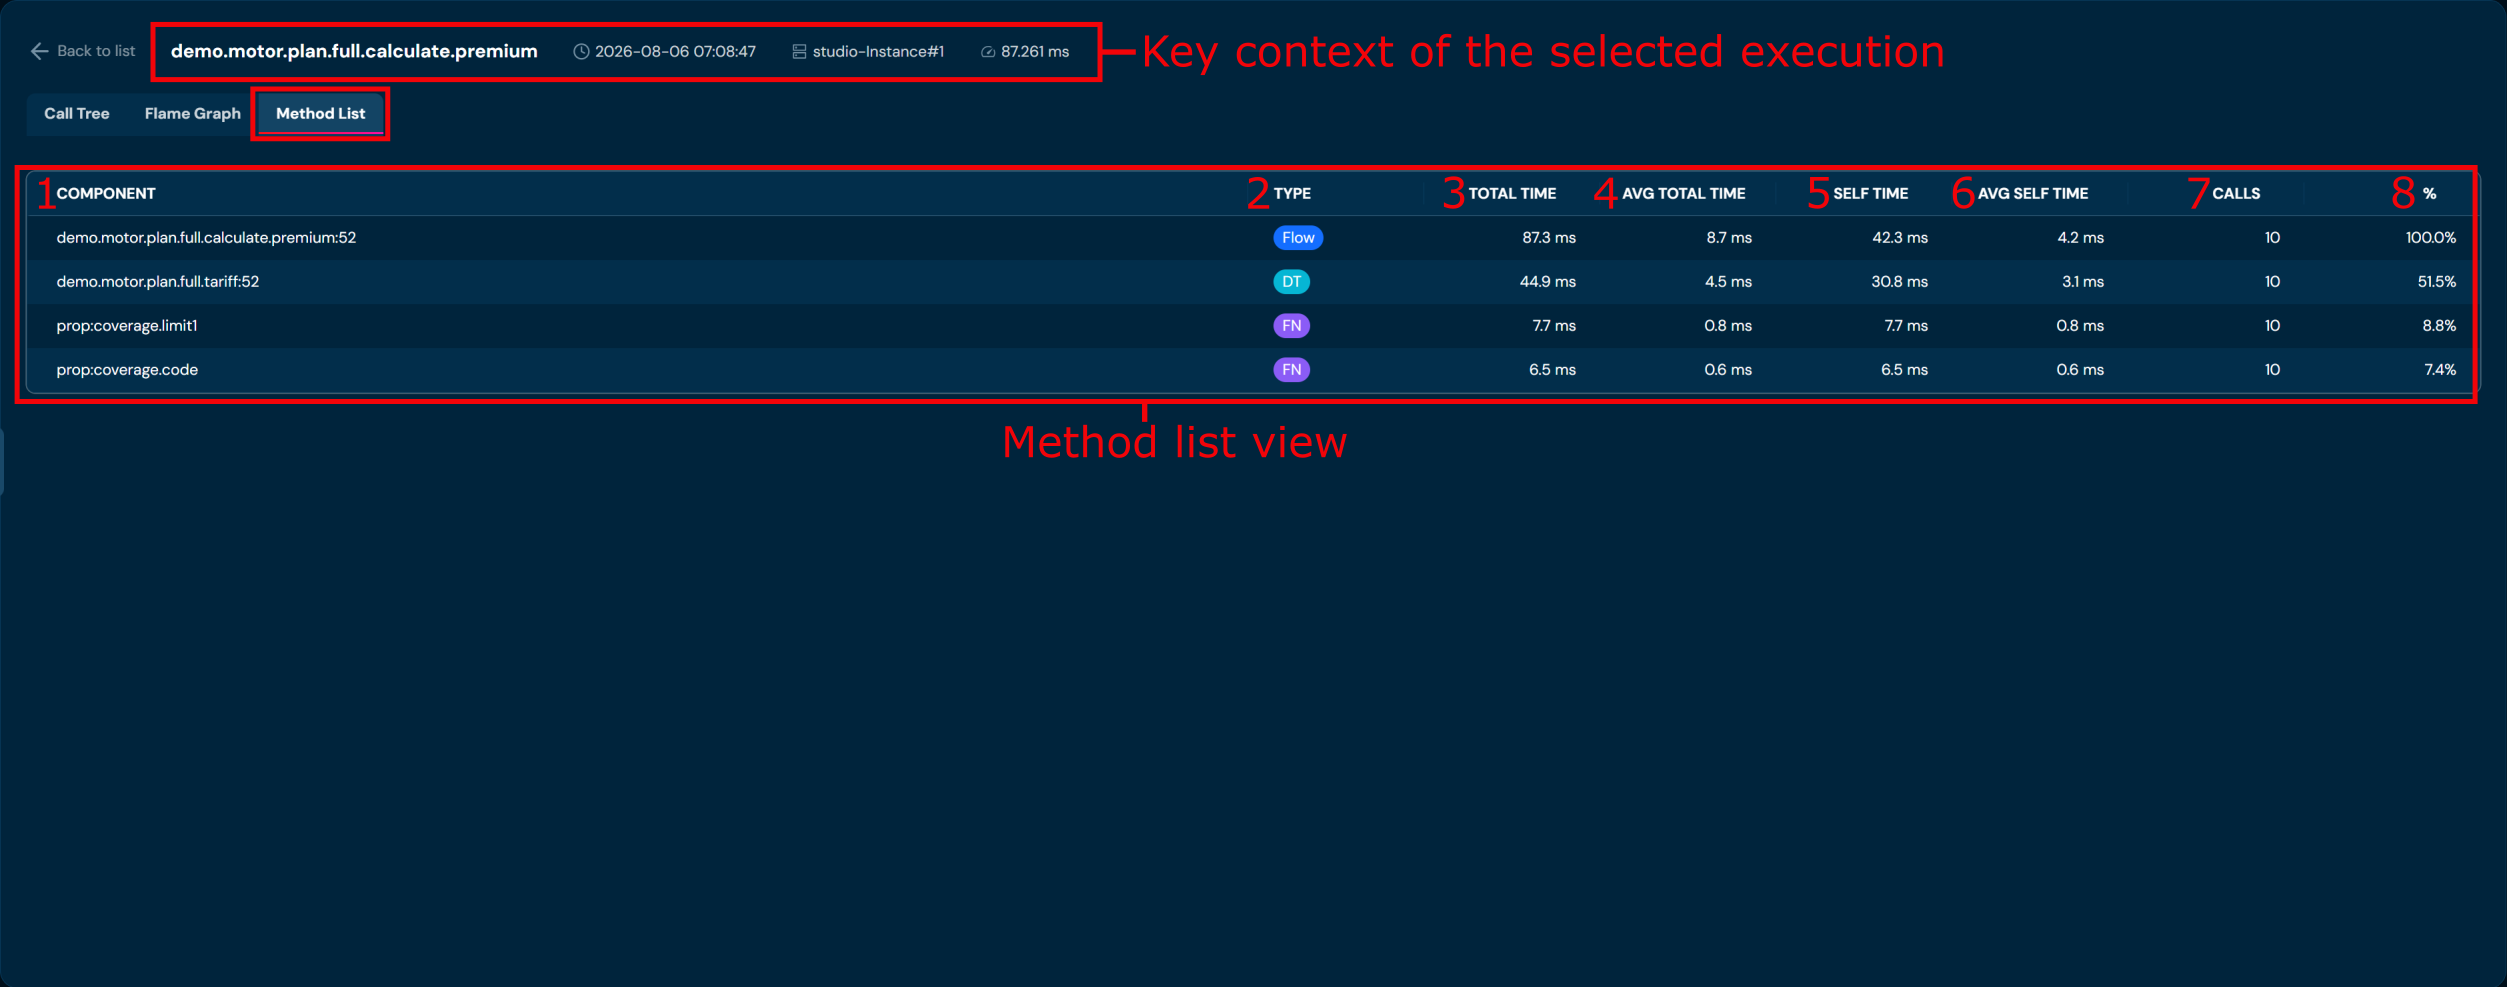
The Method List is a flat, aggregated table of every component that took part in the execution. Unlike the Call Tree, it does not preserve the call hierarchy — the same component is listed only once, with its metrics summed across all its invocations, no matter where in the tree it was called. Each row shows the Component name (with a type badge), its Type (Flow, FN, DT, or Domain), the time metrics (Total Time, Avg Total Time, Self Time, Avg Self Time), and the Calls column with the number of times the component was invoked during this execution. This makes it easy to spot the components that consumed the most time or were called most often, independently of how the calls were nested.
Use cases:
- Diagnosing why a specific execution was slow — drilling into which nested rule consumed the most time (Self Time)
- Identifying the most frequently called component within a single execution (Calls column)
- Comparing the total time of a rule against the self time of its nested calls to locate bottlenecks
Use Cases#
- Detecting bottlenecks — quick identification of the slowest rules
- Load distribution analysis — which servers (Runtime 1/2, Studio, Rest) handle which operations
- Performance comparison — between different rule types (Flow vs FN vs DT)
- Debugging — correlating timestamps with application logs
- Performance regression testing — comparing times before and after deploying changes
Monitoring Tab#
The Monitoring tab provides real-time server resource monitoring through interactive charts and tables. Data is automatically refreshed every few seconds. Each chart has a set of controls.
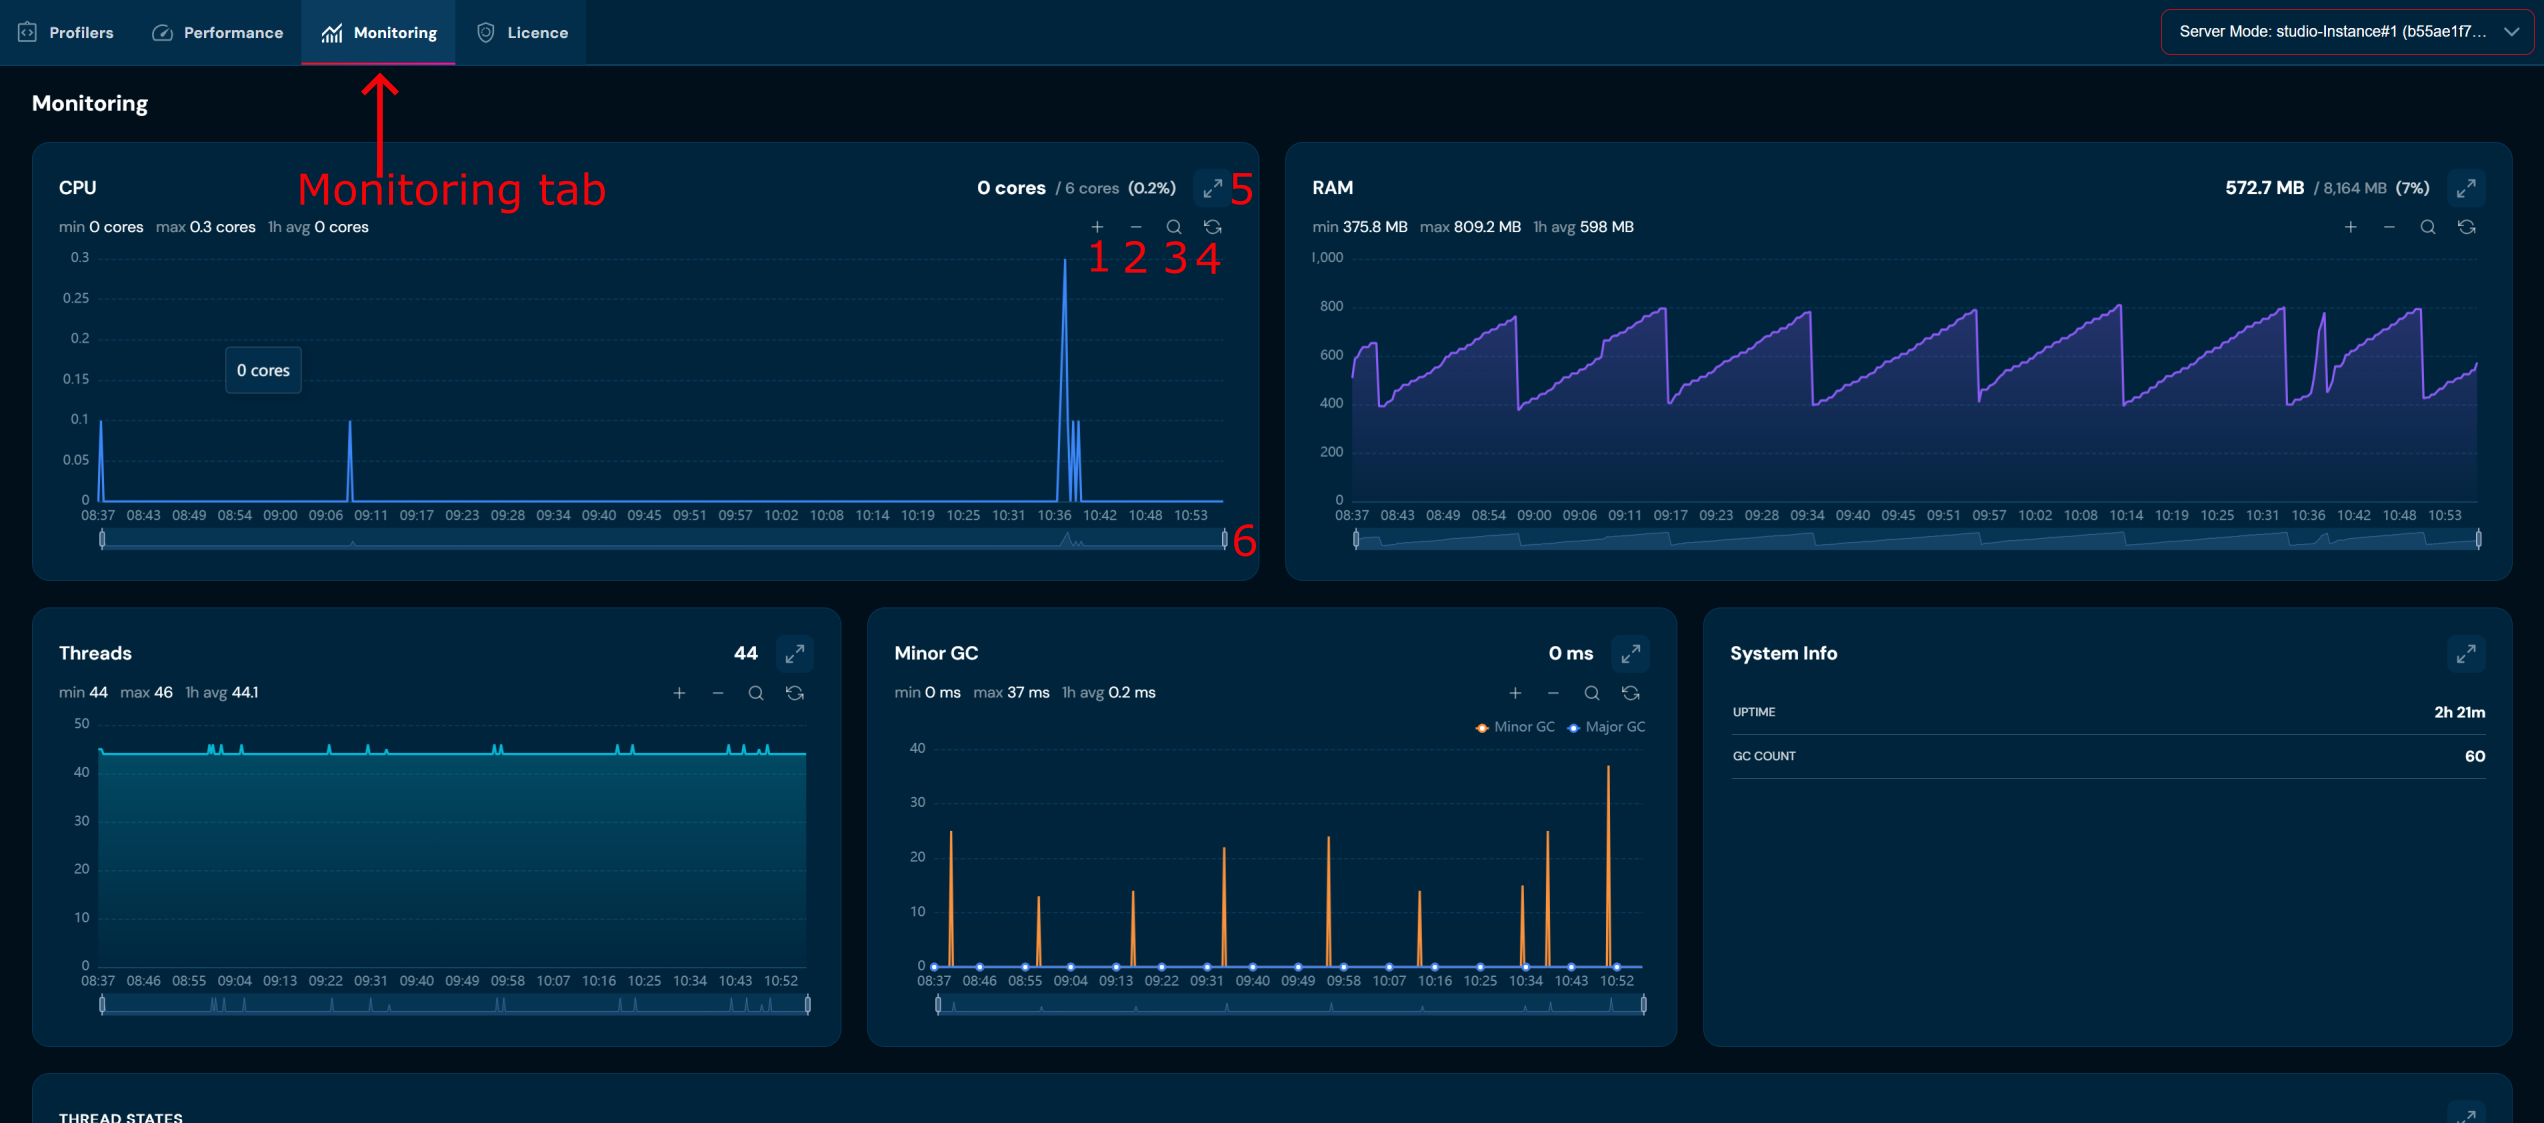
| No. | Name | Description |
|---|---|---|
| 1. | + | Click + to zoom in. |
| 2. | - | Click - to zoom out. |
| 3. | Magnifying glass | Select the Magnifying glass and highlight the area of interest. |
| 4. | Refresh | Manual data refresh. |
| 5. | Expand | Full-screen chart view. |
| 6. | Range slider | Move the range sliders to adjust the displayed view. |
Resource Charts#
CPU#
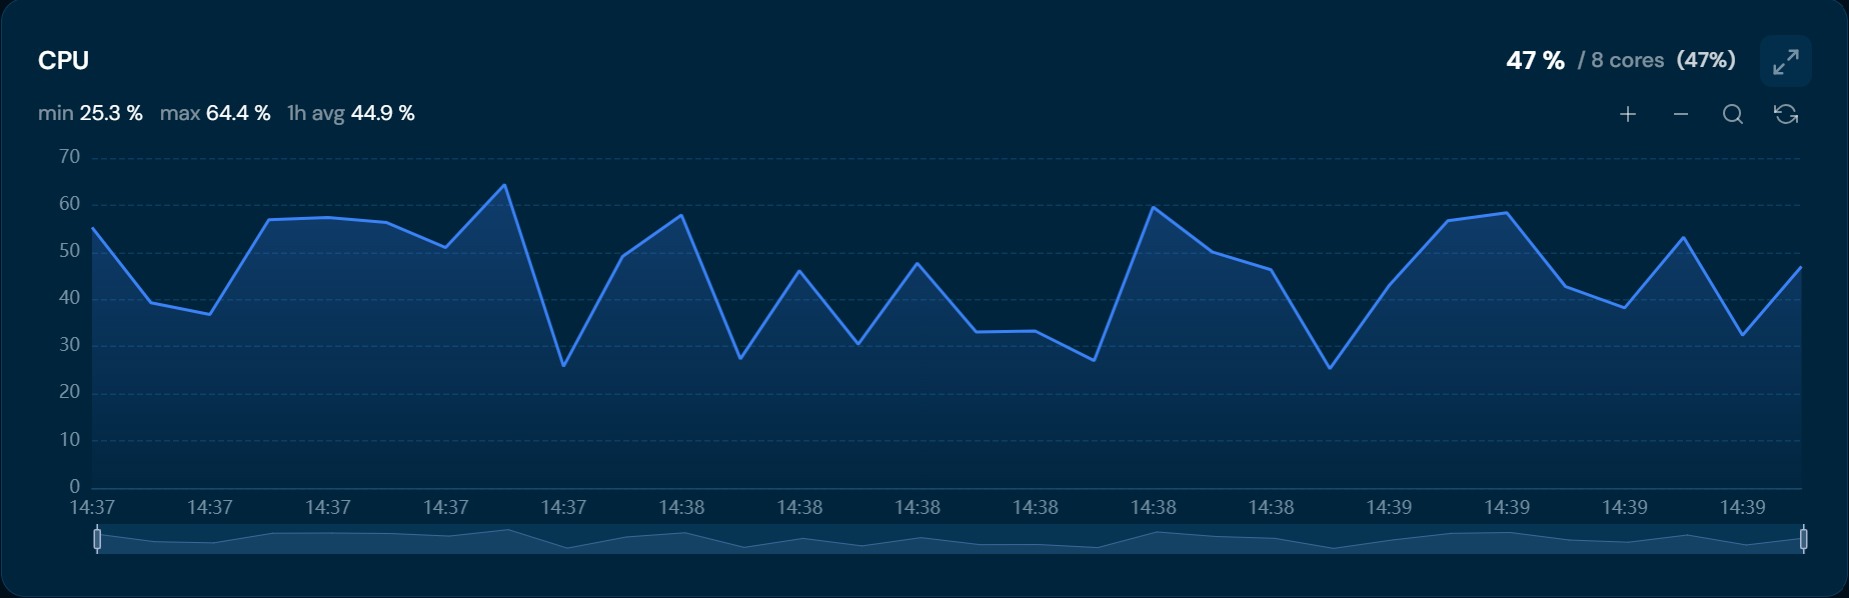
Server processor load chart over time, expressed in CPU cores. Displays:
- Current value — cores in use out of the total available, with the percentage (e.g.,
0 cores / 12 cores (0%)) - min / max / 1h avg — statistics for the last hour
- Two series on the chart: Process CPU (load generated by the Higson process) and System CPU (total system load)
- Interactive chart with zoom capability (+/-)
RAM#
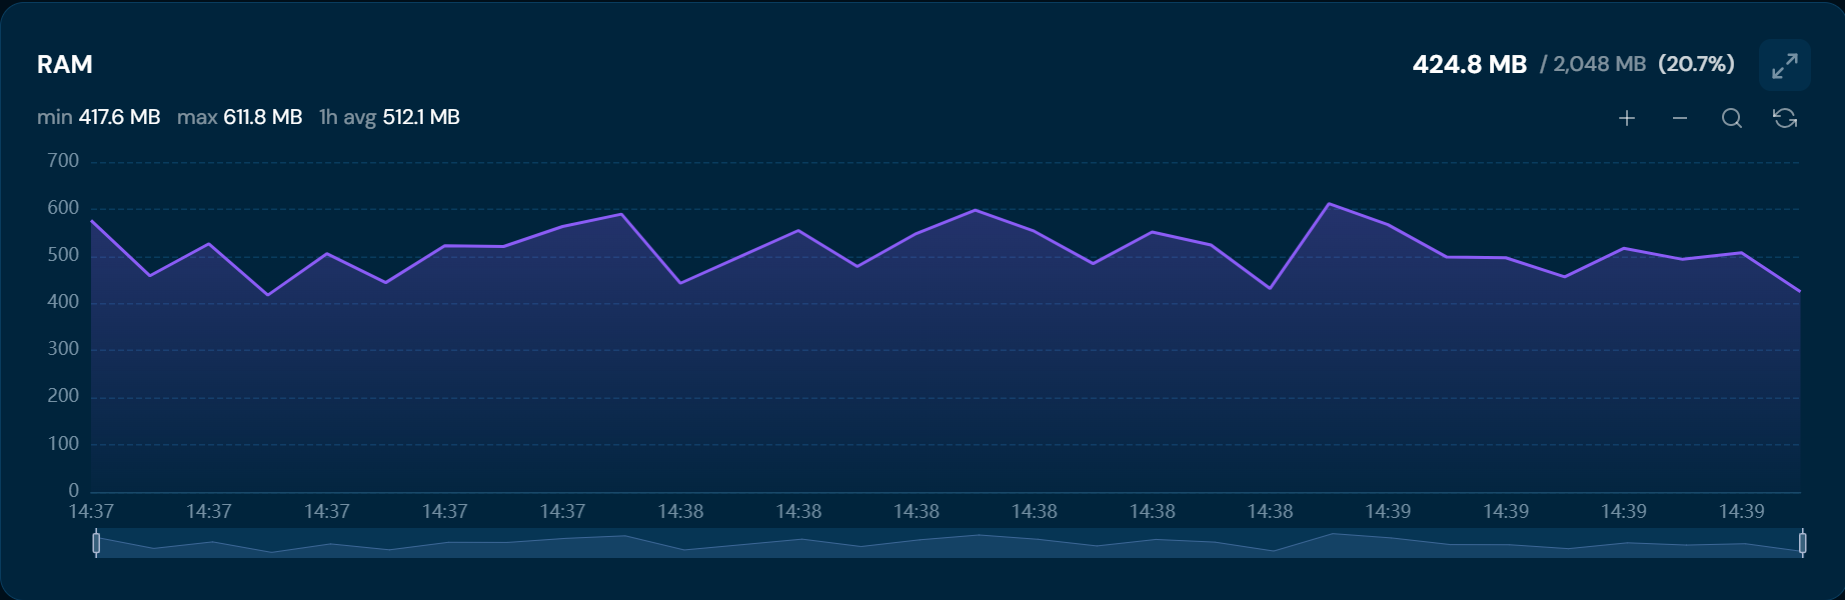
Server memory usage chart:
- Current value — memory in use out of the total available, with the percentage (e.g.,
175.1 MB / 1,944 MB (9%)) - min / max / 1h avg — e.g., min 422.4 MB, max 610.5 MB, 1h avg 517.8 MB
- Chart with trend visualization
Threads#
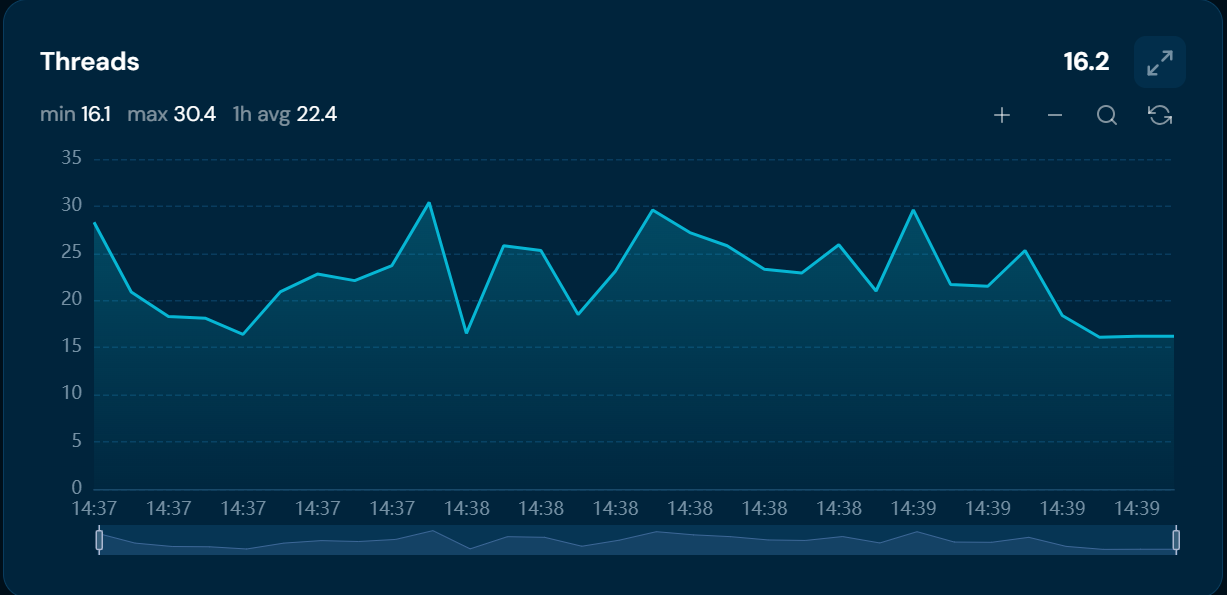
JVM active thread count chart:
- Current value (e.g., 25)
- min / max / 1h avg — thread statistics
Minor GC (Garbage Collection)#
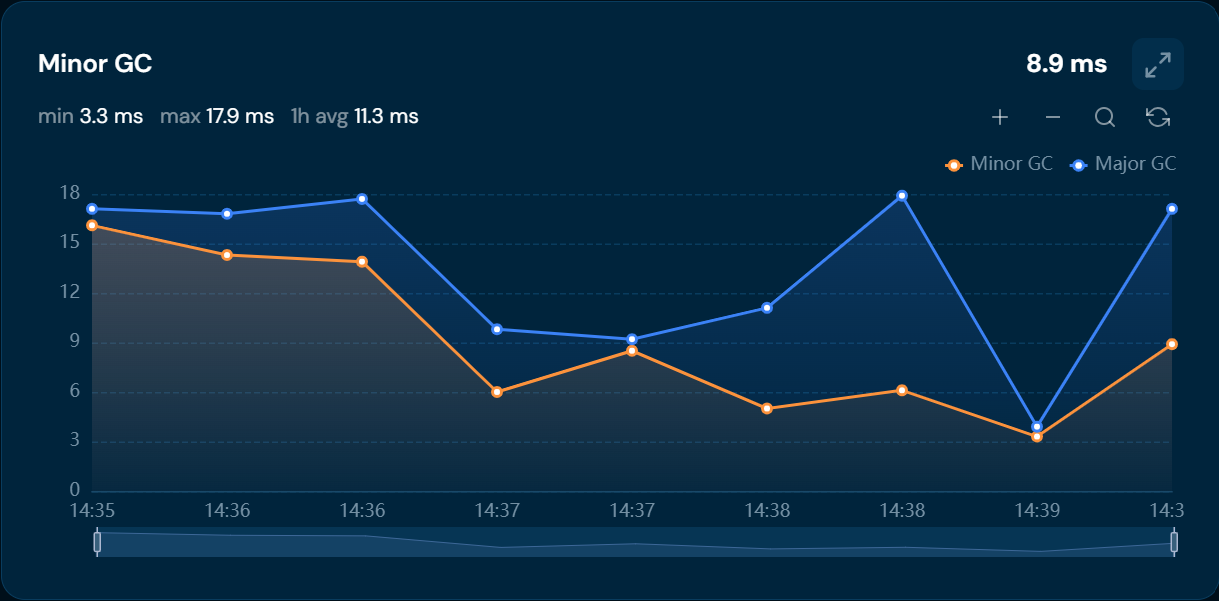
Garbage Collection operation time chart divided into:
- Minor GC (orange) — frequent, fast garbage collection
- Major GC (purple) — less frequent, longer operations
- min / max / 1h avg — e.g., min 4.2 ms, max 16.9 ms
System Info#
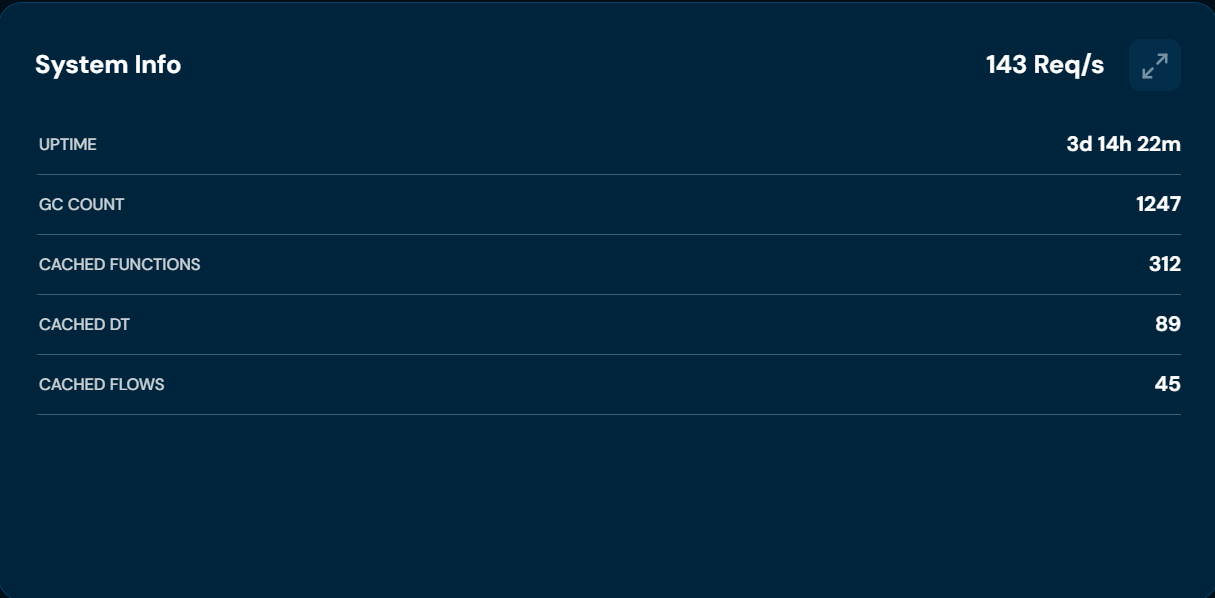
Panel with key system metrics of the selected node:
- Instance Name — name of the node instance (e.g.,
studio-Instance#1) - PID — process identifier of the Higson process
- Host IP — IP address of the host running the instance
- Runtime Version — version of the running Higson runtime (e.g.,
4.3.1-SNAPSHOT) - Virtual CPU — number of virtual CPU cores available to the instance
- Uptime — server uptime (e.g.,
1h 20m) - Start Time — date and time the instance was started
- GC Count — total number of GC operations
Thread States#
Table with the states of all JVM threads on the server:
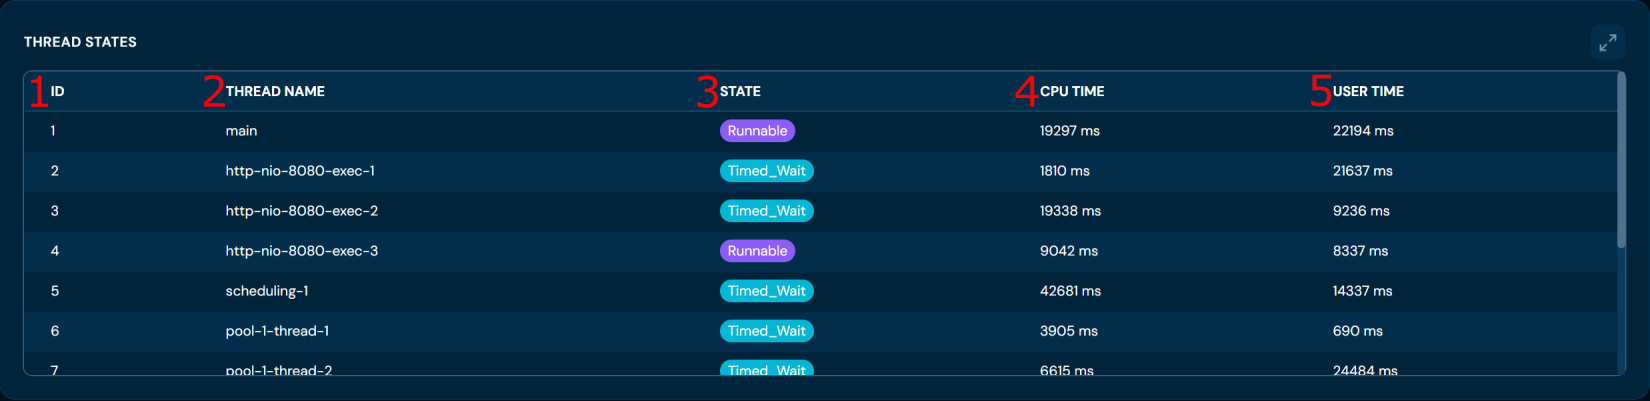
| No. | Column | Description |
|---|---|---|
| 1. | ID | Thread identifier. |
| 2. | Thread Name | Thread name (e.g., pool-1-thread-1, HikariPool-1-housekeeper, GC-worker-1). |
| 3. | State | Thread state — indicated by a colored badge: • Runnable (green) — thread is actively executing code • Timed Waiting (orange) — thread is waiting with a time limit • Waiting (amber) — thread is waiting for a notification. |
| 4. | CPU Time | CPU time consumed by the thread (ms). |
| 5. | User Time | CPU time spent executing application code in user mode (excluding kernel/system operations like I/O or memory allocation), sourced from JVM’s ThreadMXBean.getThreadUserTime. |
Use Cases#
- Load monitoring — ongoing control of CPU, RAM, thread count
- Memory leak detection — observing RAM trends over time
- GC diagnostics — identifying excessive Garbage Collection operations
- Thread analysis — detecting threads in deadlock state or with excessive CPU usage
Licence Tab#
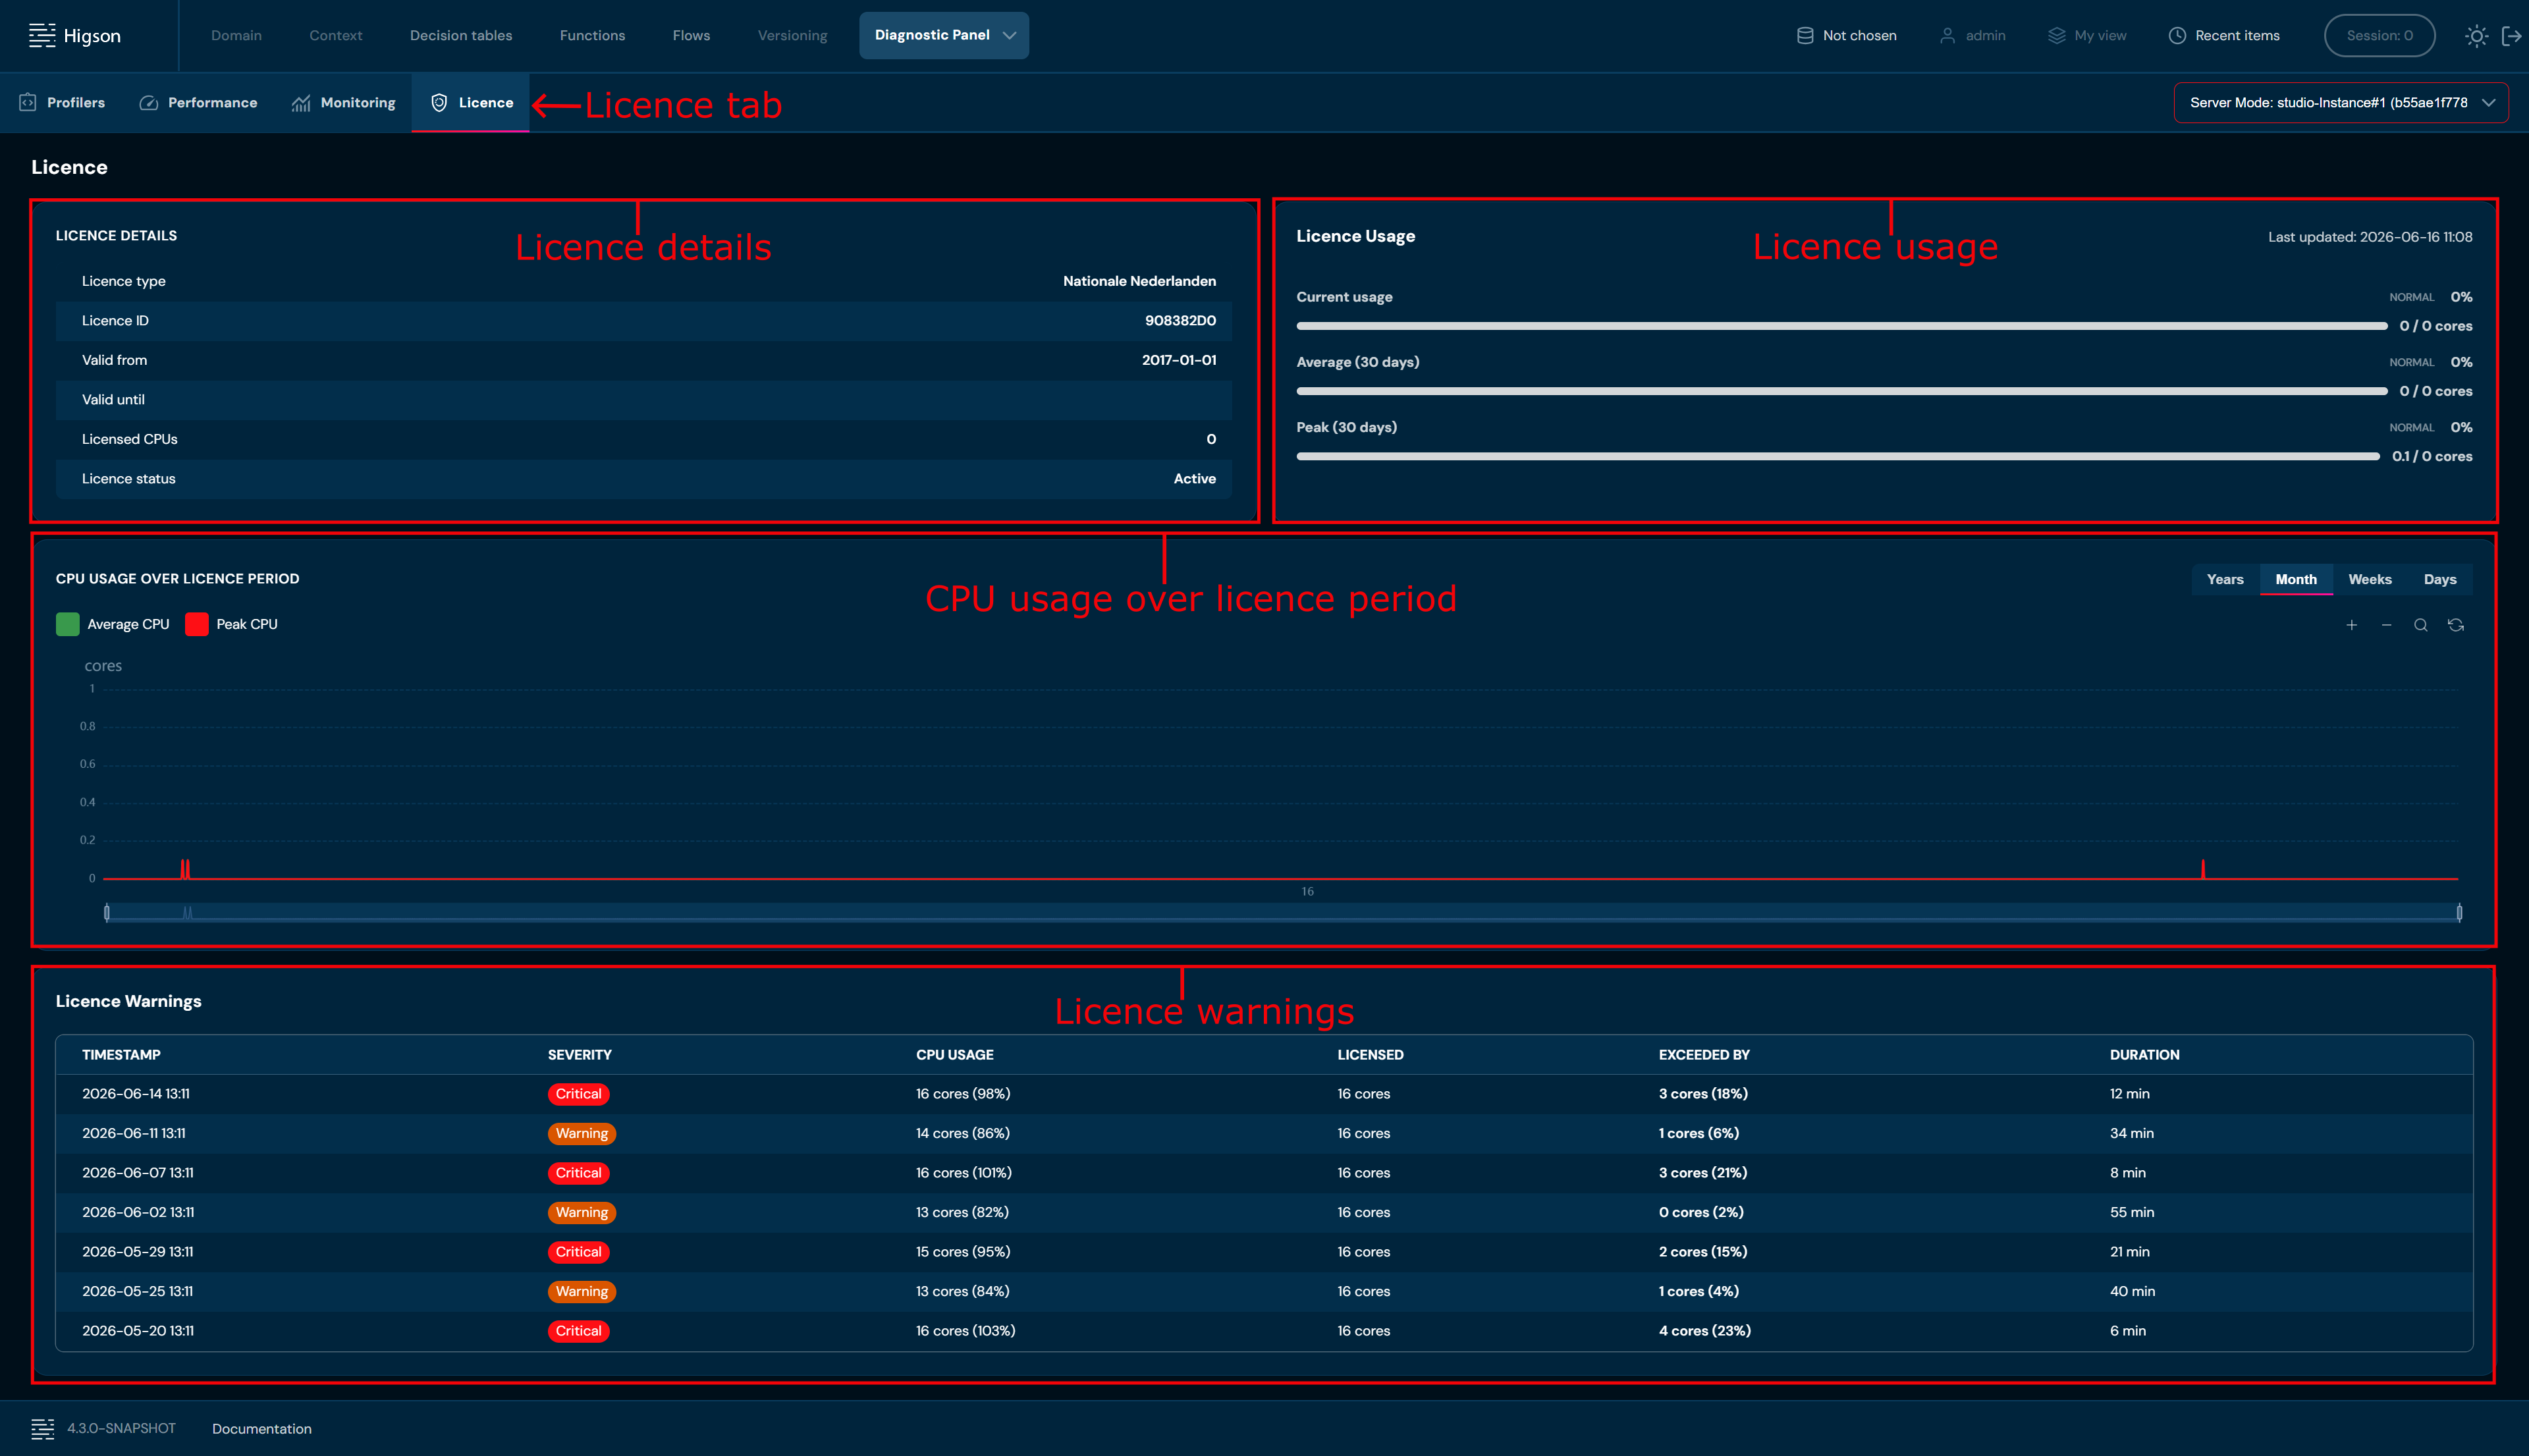
The Licence tab provides full insight into the Higson licence status, its usage, and compliance with limits.
Licence Details#
Panel with licence details:
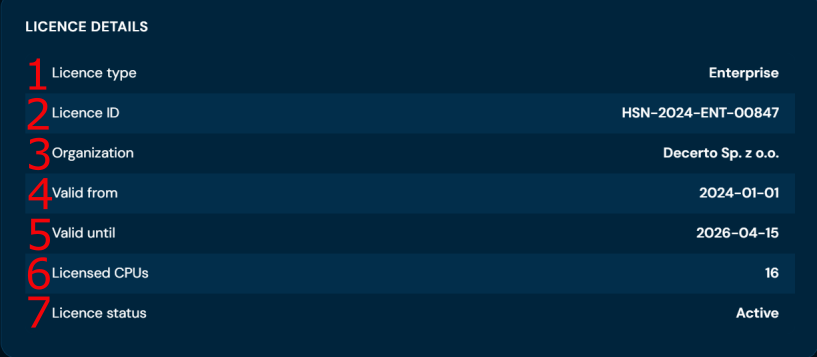
| No. | Parameter | Description |
|---|---|---|
| 1. | Licensee | Name of the entity the licence is assigned to. |
| 2. | Licence ID | Unique licence identifier. |
| 3. | Valid from | Licence validity start date. |
| 4. | Valid until | Licence expiration date. |
| 5. | Licensed CPUs | Maximum number of CPU cores allowed under the licence. |
| 6. | Licence status | Current licence status (e.g., Active, Expired). |
Licence Usage#
Visualization of current licensed CPU core usage with three indicators:
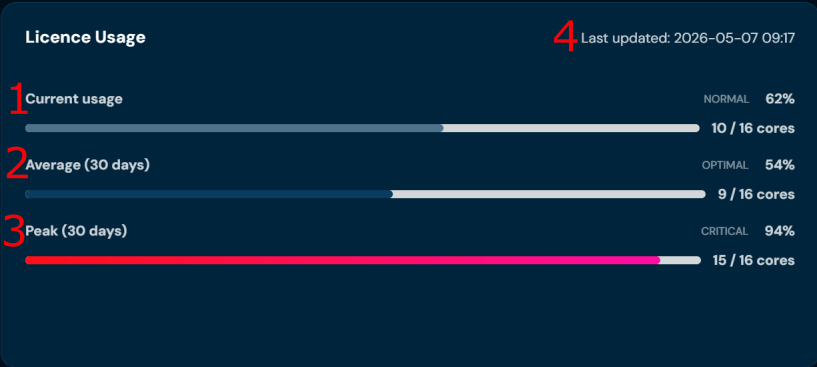
| No. | Metric | Description |
|---|---|---|
| 1. | Current usage | Number of CPU cores currently in use, shown as a ratio with percentage and status label. |
| 2. | Average (30 days) | Average CPU core usage over the last 30 days. |
| 3. | Peak (30 days) | Highest recorded CPU core usage over the last 30 days. |
| 4. | Last updated | Timestamp of the most recent data refresh for this section. |
Each indicator has a colored progress bar and a status label:
- OPTIMAL (blue) — usage within normal range
- NORMAL (gray) — acceptable usage
- CRITICAL (red) — usage near or exceeding the limit
Data in the Licence Usage and Performance Metrics sections includes “Last updated” information with the date and time of the last refresh. Data may be updated at different intervals.
CPU Usage Over Licence Period#
Historical chart of CPU usage over the licence period with two lines:
- Average CPU (green) — average core usage
- Peak CPU (red) — peak core usage
The chart contains two threshold lines:
- Yellow line (dashed) — warning threshold
- Red line (dashed) — critical threshold (licence limit)
Available time ranges: Years, Month, Weeks, Days

Licence Warnings#
Table listing all recorded licence limit violations. Each row represents a single event where CPU core usage exceeded the licensed limit.

| No. | Column | Description |
|---|---|---|
| 1. | Timestamp | Exact date and time when the violation occurred. |
| 2. | Severity | Violation severity level: Critical (significant breach) or Warning (minor breach). |
| 3. | CPU Usage | Actual CPU core usage recorded at the time of the violation. |
| 4. | Licence Limit | Maximum number of CPU cores allowed under the licence. |
| 5. | Exceeded By | How much the usage exceeded the limit, shown as absolute value and percentage (e.g., +2.4 cores (15%)). |
| 6. | Duration | How long the violation lasted before usage returned below the limit. |
Each row has an expand button (→) that opens the Warning Details modal with additional information. The modal contains two sections:
- Violation Summary — three cards with key metrics.
- Top Processes During Violation — table listing the processes that consumed the most CPU at the time of the violation.
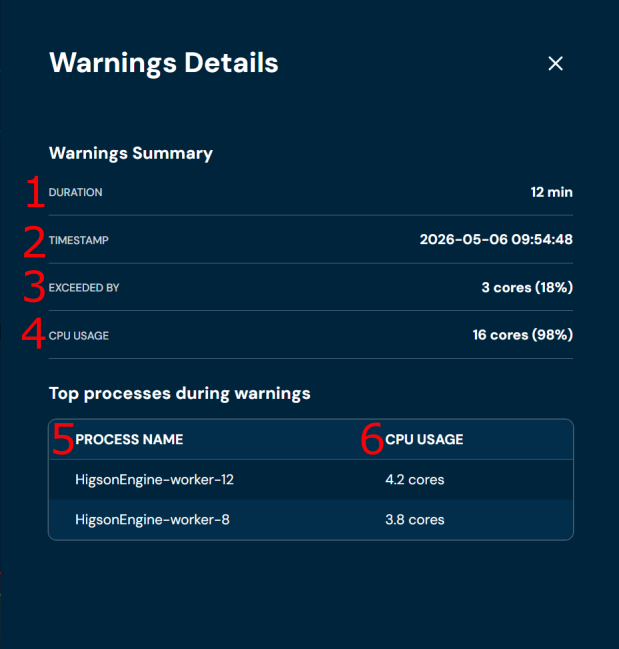
| No. | Element | Description |
|---|---|---|
| 1. | Duration | How long the violation lasted before usage returned below the limit. |
| 2. | Timestamp | Exact date and time when the violation occurred. |
| 3. | Exceeded By | How much the usage exceeded the limit, shown as absolute value and percentage. |
| 4. | CPU Usage | CPU core usage by that process at the time of the violation. |
| 5. | Process Name | Name of the JVM thread or process (e.g., HigsonEngine-worker-12). |
| 6. | CPU Usage | CPU core usage by that process at the time of the violation per process. |
Use Cases#
- Capacity planning — analyzing CPU usage trends vs licence
- Licence management — monitoring approaching expiration
- Compliance — controlling compliance with licence terms
- Billing — documenting actual resource usage